
Figures & data
Table 1. Gene-specific primers for ATG16L1, MAP1LC3A and GAPDH.
Figure 1. Nanopore-based sequencing bulk transcriptome profiles of hsa-miR-141 mimic and hsa-miR-141 inhibitor transfected ATCC PC3 cells line, compared to intact PC3 cells transcriptome. (A) Library generation strategy, using ligation sequencing kit 1D (LSK108). (B) Quality score vs. base reads. Inset: Long-read counts distribution across experiments. Right: Corresponding reads mapped across GRCh38 human reference genome by SeqMonk. Differential expression analysis was done within SeqMonk. (C) Violin and bar-chart plots of reads distribution within experimental condition(s), before and after normalization in SeqMonk. (D) FastQC reads qualification. (E). G:profiler (g:GOSt) gene set enrichment analysis of SeqMonk differential expression data with pathway enrichments using reactome database.
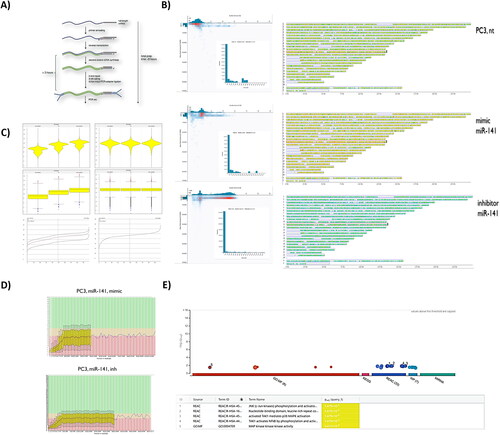
Table 2. Enriched pathways after miR-141 mimic and inhibitor transfection, compared to non-transfected PC3 cells.
Table 3. Significantly changed differential expression of transcripts after miR-141 mimic transfection (‘tumour suppressed phenotype’).
Table 4. Significantly changed differential expression of transcripts after miR-141 inhibitor transfection (‘tumour enrichment phenotype’).
Figure 2. Effect of miR-141 mimic and siMAPK1 on ATG16L and LC3 autophagy markers expression in LNCaP and PC3 cell lines. (A) Relative expression of ATG16L and LC3-I transcripts after 24 h transfection with miR-141 in PC3 cell line compared to non-treated cells (nt) and (B) after 48 h transfection with siMAPK1 in LNCaP and PC3 cell lines compared to non-treated cells (nt). (C) Flow cytometry analysis of ATG16L and LC3 protein expression after transfection of miR-141 mimic or inhibitor for 24 h in LNCaP and PC3 cell lines compared to non-treated cells (nt). MiR-141 suppressed ATG16L and increased LC3 expression at the protein level in LNCaP cells, while in PC3 miR-141 slightly increased the protein expression of both markers. (D) Flow cytometry analysis of ATG16L and LC3 protein expression after gene silencing of MAPK1 in LNCaP and PC3 cell lines compared to non-treated cells (nt). MAPK1 silencing slightly suppressed the protein expression of ATG16L and LC3 autophagy markers in the LNCaP cell line, while the reverse was observed in PC3 cells. The protein abundance of ATG16L and LC3 was detected using intracellular flow cytometry with ATG16 (C-20) and MAP LC-3β (N-20) goat polyclonal antibodies. Expression was assessed using the MFI parameter from FCS histograms, with values normalized to a control value of 1. Asterisks above bars denote statistically significant differences as determined by ANOVA (**p < 0.01).
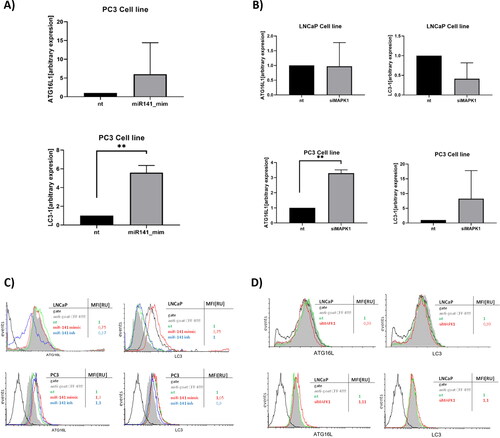
Figure 3. Effect of miR-141 mimic and siMAPK1 on macroautophagy under intact and starved conditions was evaluated using LC3 analogue dye DAPGreen (Dojindo). (A) flow cytometry histogram (left) analysis of DAPGreen intensity in LNCaP cells in non-treated (nt; purple), starvation (green), miR-141 mimic transfected in high glucose (blue) and miR-141 mimic transfected in low glucose (starvation) conditions (yellow). and flow cytometry histogram (right) analysis of DAPGreen intensity in PC3 cells in non-treated (nt; purple), starvation (green), miR-141 mimic transfected in high glucose (yellow) and miR-141 mimic transfected in low glucose (starvation) conditions (red). (B) Median with error bars plot of the MFI data obtained from non-treated (nt), starved (nt_starvation), miR-141 mimic transfected under starvation (miR-141_starvation) and miR-141 mimic transfected in normal (high glucose) conditions. (C) Selected representative FITC filtered fluorescent images from Etaluma LS620 live inverted fluorescent imaging of LNCaP and PC3 cells treated under same conditions as in (B), and (D) White (bright) field images merged with FITC filtered fluorescent channel of PC3 cells treated under same conditions as in (B). (E) Flow cytometry histogram analysis of DAPGreen intensity in LNCaP cells in non-treated (nt; black), starvation (green), siMAPK transfected in high glucose (yellow) and miR-141 mimic transfected in low glucose (starvation) conditions (purple). and flow cytometry histogram analysis of DAPGreen intensity in PC3 cells in non-treated (nt; black), starvation (red), siMAPK transfected in high glucose (yellow) and miR-141 mimic transfected in low glucose (starvation) conditions (blue). (F) Median with error bars plot of the MFI data obtained from non-treated (nt), starved (nt_starvation), siMAPK1 transfected under starvation (siMAPK1 _starvation) and siMAPK1 transfected in normal (high glucose) conditions. (G) Selected representative FITC filtered fluorescent images from Etaluma LS620 live inverted fluorescent imaging of PC3 cells treated under same conditions as in (F) and (H) White (bright) field images merged with FITC filtered fluorescent channel of PC3 cells treated under same conditions as in (F). All microscopy images have scale bar of 50 µm. Expression in (B) and (F) is assessed using the MFI parameter from FCS histograms, with values normalized to a control value of 1.
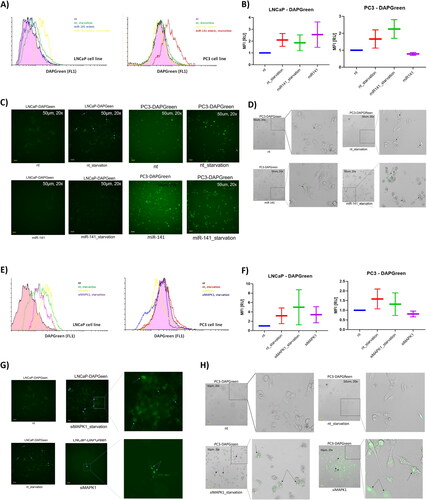
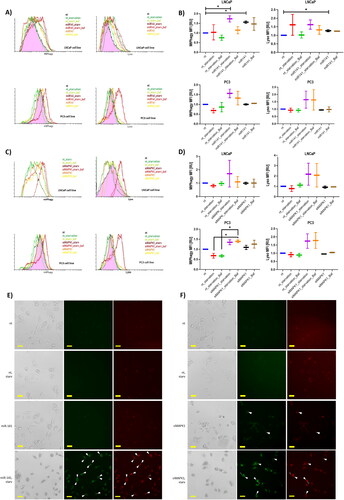
Figure 4. Impact of miR-141 mimic and siMAPK1 on mitophagy flux: assessments under normal, starvation, and bafilomycin A treatment conditions using MtPhagy and Lyso dyes (Dojindo) for mitophagy and lysosomes, respectively. (A) Flow cytometry histogram analysis of MtPhagy and Lyso dyes intensity in LNCaP and PC3 cells in non-treated (nt), starvation (nt_starvation), starvation after bafilomycin A treatment (nt_starv_Baf), miR-141 mimic transfected in high glucose (miR-141), and after bafilomycin A treatment (miR-141_Baf), and miR-141 mimic transfected in low glucose (miR-141_starv) conditions, and after bafilomycin A treatment (miR-141_starv_Baf). (B) Median with error bars plot of the MFI data obtained from non-treated (nt), starvation (nt_starvation), starvation after bafilomycin A treatment (nt_starvation_Baf), miR-141 mimic transfected in low glucose (miR-141_starvation) conditions, and after bafilomycin A treatment (miR-141_starvation_Baf), and miR-141 mimic transfected in high glucose (miR-141), and after bafilomycin A treatment (miR-141_Baf). statistically significant differences (p < 0.05) are shown using asterisks. (C) Flow cytometry histogram analysis of MtPhagy and Lyso dyes intensity in LNCaP and PC3 cells in intact (nt), starvation (nt_starvation), starvation after bafilomycin A treatment (nt_starv_Baf), siMAPK1 transfected in high glucose (siMAPK1), and after bafilomycin A treatment (siMAPK1_baf), and siMAPK1 transfected in low glucose (siMAPK1_starv) conditions, and after bafilomycin A treatment (siMAPK1_starv_baf). (D) Median with error bars plot of the MFI data obtained from intact (nt), starvation (nt_starvation), starvation after bafilomycin A treatment (nt_starvation_Baf), siMAPK1 transfected in low glucose (siMAPK1_starvation) conditions, and after bafilomycin A treatment (siMAPK1_starvation_Baf), and siMAPK1 transfected in high glucose (siMAPK1), and after bafilomycin A treatment (siMAPK1_Baf). statistically significant differences (p < 0.05) are shown using asterisks. (E) and (F) Non-treated (nt), starved (starv), miR-141 mimic transfected in high glucose (miR-141) and miR-141 mimic transfected in low glucose (miR-141 starv) conditions PC3 cells, showing cell morphology, Lyso dye fluorescence (green) and Mtphagy dye fluorescence (red) on Etaluma LS620 inverted microscope. Cells with co-localisation are shown with white full triangle, cells with lacking colocalization are shown with transparent triangle. All microscopy images have a scale bar of 25 µm. Expression in (B) and (F) is assessed using the MFI parameter from FCS histograms, with values normalized to a control value of 1. Asterisks above bars denote statistically significant differences as determined by ANOVA (*p < 0.05).
Data availability statement
The data that support the findings of this study are available from the corresponding author, KT, upon reasonable request.