
Figures & data
Table 1. Results after application of the PROMETHEE II method.
Table 2. Various weights for 4th batch process.
Table 3. Optimal estimated parameters of the fourth case.
Figure 1. Concentration of biomass, lactose and oxygen for the 1st batch experiment. Xej, Sej and Cej – the experimental data for the four batch experiments, j = 1, …, 4; Xk,j – biomass concentration results obtained by using the model parameters for the first (k = 1) and the second case (k = 2), j = 1, …, 4. The indices ‘k,j’ for the concentration of lactose (Sk,j) and oxygen (Ck,j) are the same as those for Xk,j; Xmj, Smj and Cmj – simulated results obtained by the optimal solutions (case 4 in ) of the model.
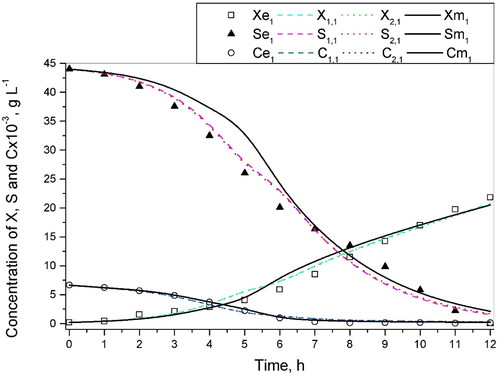
Figure 2. Concentration of biomass, lactose and oxygen for the 2nd batch experiment.
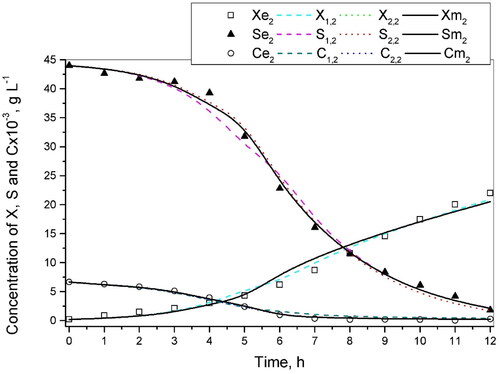
Figure 3. Concentration of biomass, lactose and oxygen for the 3rd batch experiment.
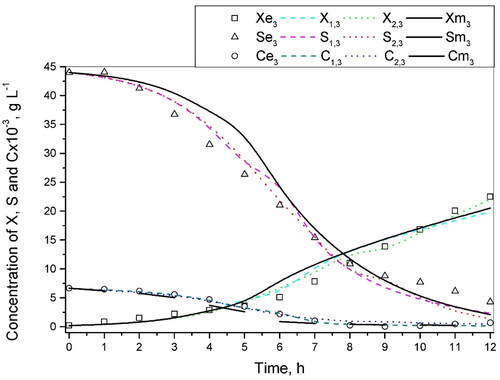
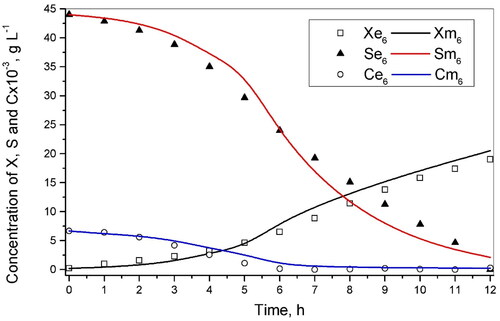
Figure 4. Concentration of biomass, lactose and oxygen for the 4th batch experiment.
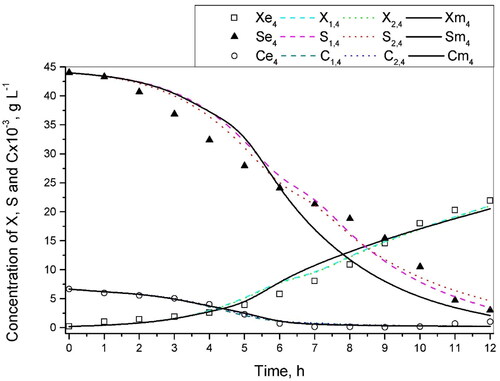
Figure 5. Concentration of biomass, lactose and oxygen for the tested results of the 5th batch experiment. Xej, Sej and Cej – experimental data of biomass, lactose and oxygen concentration for 5th and 6th test batch processes; Xmj, Smj and Cmj (j = 5, 6) – simulated data, respectively.

Figure 6. Concentration of biomass, lactose and oxygen for the tested results of the 6th batch experiment.
Supplemental Material
Download PDF (1.1 MB)Data availability statement
All data that support the findings reported in this study are available from the corresponding authors [MP] and are shown in the Supplemental Appendix, which is an integral part of the article.