
Figures & data
Figure 1. Three-dimensional representation of the Atomic Force micrographs of mechanically polished 3 micron (a) and 400 grit (b) finished surfaces.
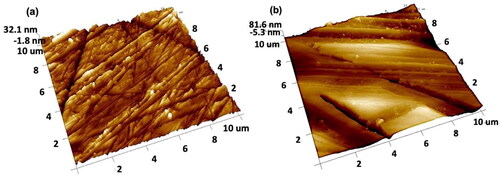
Figure 2. Representative SEM images of smooth (a) and rough (b) alloy surfaces.
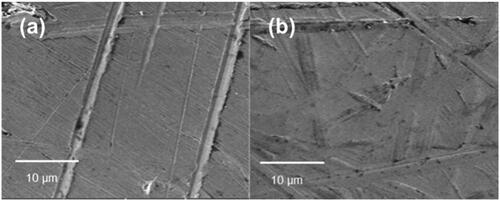
Figure 3. Scanning electron micrographs depicting the smooth surface on day 3 (a), day 6 (c) and day 13 (e) and rough surfaces on day 3 (b), day 6 (d) and day 13 (f).
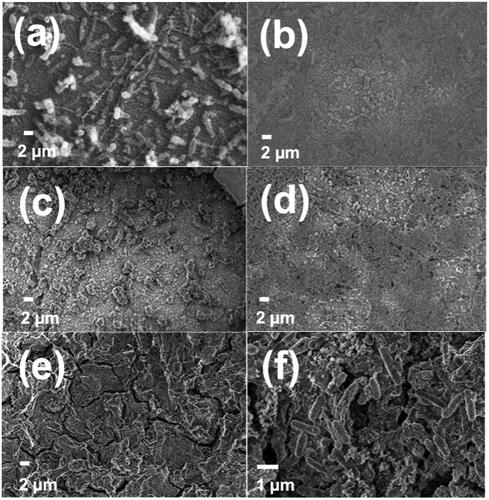
Figure 4. Scanning electron micrograph of the original etched alloy A (without batch media exposure) revealing the perlite (dark area) and ferrite (light area) phases. The lamellae can be seen in the perlite.
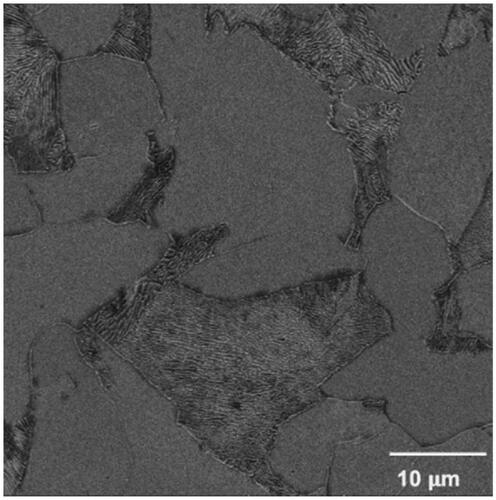
Table 1. Bacterial abundance on the alloy surface determined by rDNA gene sequencing, with top 5 species.
Figure 6. Scanning electron micrographs after cleaning the corrosion products on the abiotic surfaces, depicting the smooth surface on day 3 (a), day 6 (c) and day 13 (e) and rough surfaces on day 3 (b), day 6 (d) and day 13 (f).
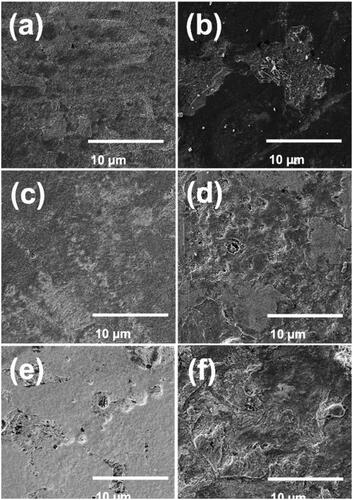
Figure 7. Raman spectra of smooth alloy A after exposure on day 3, 6 and 13, with inserts indicating lepidocrocite (a) and magnetite (b).
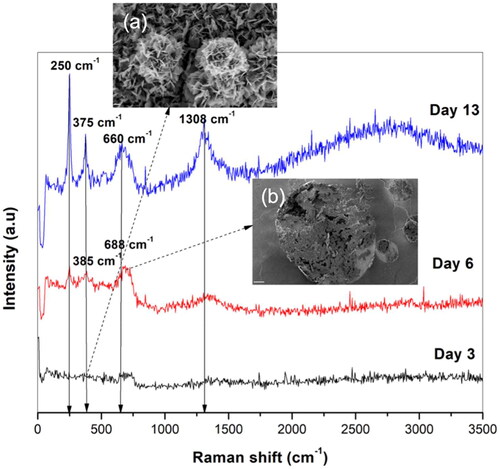
Table 2. Mean surface roughness parameters before and after bacterial exposure.
Figure 5. Scanning electron micrographs after cleaning the bacterial biofilm and corrosion products on the surfaces, depicting the smooth surface on day 3 (a), day 6 (c) and day 13 (e) and rough surfaces on day 3 (b), day 6 (d) and day 13 (f). Intergranular corrosion is indicated by the white arrows.
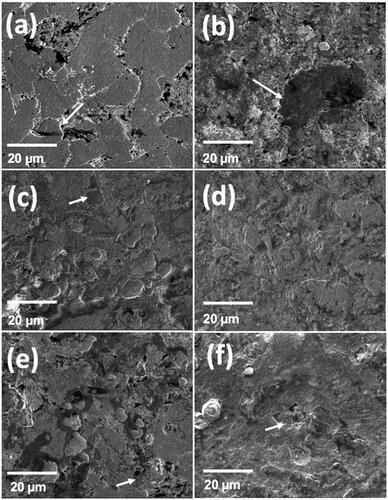
Table 3. Elemental composition of smooth alloy A (without batch media exposure) and after bacterial exposure in the biotic system (with biofilm) on days 3, 6 and 13.
Table 4. Elemental composition of the smooth alloy a of the cleaned abiotic surface (control) and cleaned biotic surface (without biofilm).
Table 5. Corrosion rates for alloy A.
Table 6. Corrosion products formation of alloy a after bacterial exposure.
Figure 8. FTIR spectra of alloy A day 3 showing acetylenic compounds stretching at 2162 cm−1. Day 6 showing the acetylenic compound peak was less intensified (2148 cm−1), and the carbonyl peak was still present at 1948 cm−1. Day 13 showing acetylenic compounds at a stretch of 2162 cm−1, indicating decreased amounts of acetic acid produced by the bacteria.
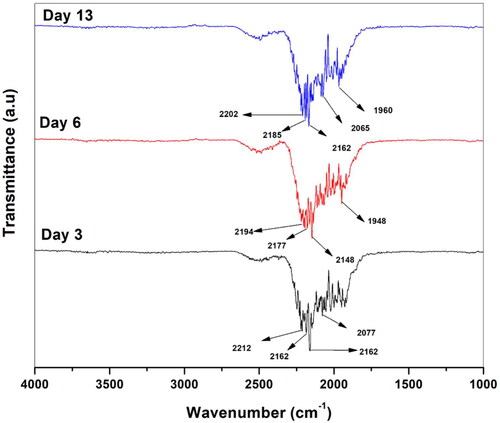
Table 7. Functional groups.
Supplemental Material
Download PDF (1.5 MB)Data availability statement
Data will be made available upon request through the corresponding author and/or the director of the project, Prof. Evans Chirwa (Email: [email protected]).