
Figures & data
Figure 1. Three different lakes (Moon Lake, Seven Star Lake and Shenlong Lake) were selected and sampled in two different months (September 2021 and December 2021) in the Saihanba Mechanical Forest Farm. The study area has a cold climate with a large temperature difference throughout the year.
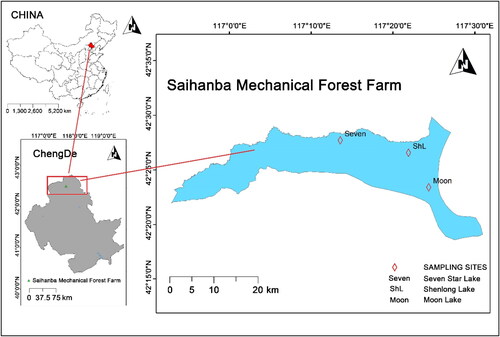
Figure 2. Alpha and beta diversity analysis based on 16S rRNA sequencing results. (A) Rarefaction curves were generated to assess the sequencing depth of water samples and sediment samples collected from Moon Lake, Seven Star Lake and Shen Long Lake. (B) Chao1 diversity index, (C) Shannon diversity index and (D) Simpson diversity index, which measures species richness, were calculated for both water samples and sediment samples. Sediment samples compared with the water samples, *p < .05. (E) NMDS (Non-Metric Multidimensional Scaling) analysis was performed based on Bray-Curtis distances to visualize the dissimilarities among samples. (F) PCoA (Principal Coordinates Analysis) was also conducted using Bray-Curtis distances to assess the variation and clustering patterns of samples. Specific labels were used to indicate different sample types: ST: Seven Star Lake; SL: Shenlong Lake; Mn: Moon lake; SF: sediment samples collected in fall; SW: sediment samples collected in winter; WF: water samples collected in fall; WW: water samples collected in winter.
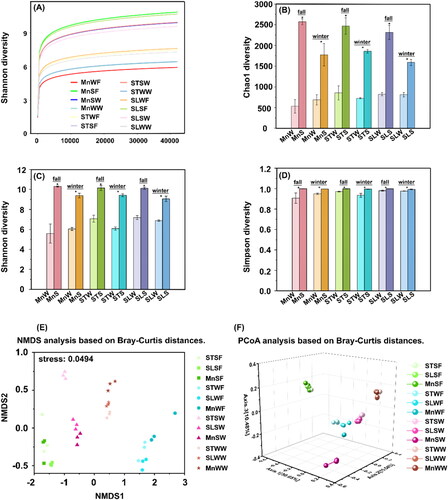
Figure 3. Classification of bacteria based on 16S rRNA gene sequences. The graphs are plotted with Origin v. 2021. (A) At the phylum level; (B) at the class level; (C) at the genus level. MnW: water samples from Moon Lake; MnS: sediment samples from Moon Lake; STW: water samples from Seven Star Lake; STS: sediment samples from Seven Star Lake; SLW: water samples from Shenlong Lake; SLS: sediment samples from Shenlong Lake.
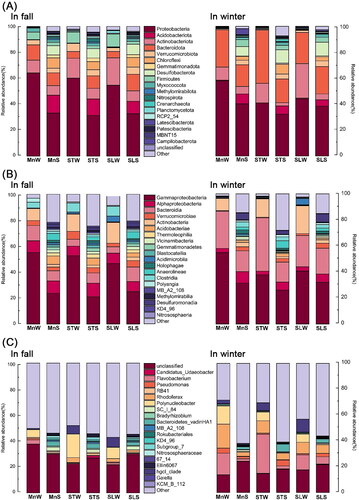
Figure 4. Cluster tree of samples constructed by cluster analysis. Family level heat maps are shown in the picture. The graphs are plotted with R software version 4.1.3. MnW: water samples from Moon Lake; MnS: sediment samples from Moon Lake; STW: water samples from Seven Star Lake; STS: sediment samples from Seven Star Lake; SLW: water samples from Shenlong Lake; SLS: sediment samples from Shenlong Lake; F: fall; W: winter.
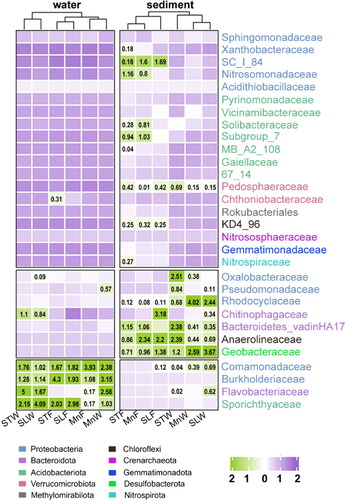
Figure 5. Venn diagram demonstrating unique and shared ASVs at the family level. The graph is built using the Wekemo Bioincloud (https://www.bioincloud.tech). (A) Among the water samples in fall, (B) among the sediment samples in fall, (C) among the water samples in winter and (D) among the sediment samples in winter of the three lakes. MnW: water samples from Moon Lake; MnS: sediment samples from Moon Lake; STW: water samples from Seven Star Lake; STS: sediment samples from Seven Star Lake; SLW: water samples from Shenlong Lake; SLS: sediment samples from Shenlong Lake; F: fall; W: winter.
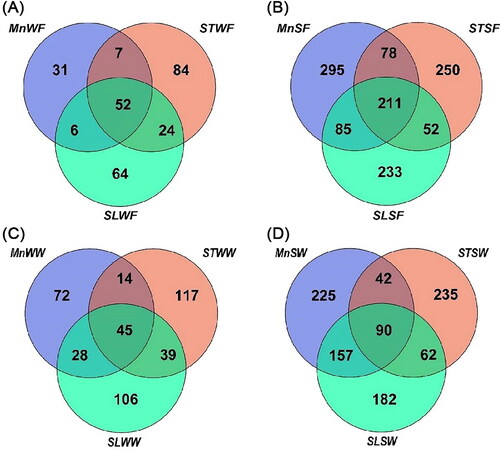
Figure 6. Bacterial community functions predicted by PICRUSt2 at level III which related to xenobiotics degradation and metabolism.
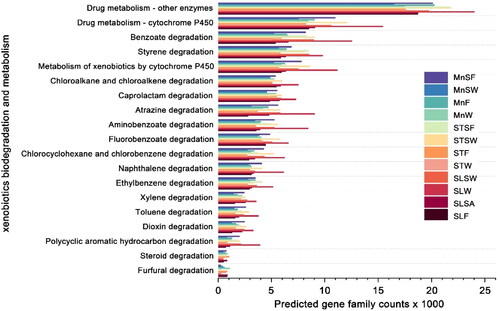
Table 1. Enzyme classes corresponding to the more abundant KEGG orthology groups (KOs).
Supplemental Material
Download PDF (1 MB)Data availability statement
The data that support the findings of this study are available from the corresponding authors upon reasonable request.