
Figures & data
Table 1. Origins and geographical characteristics of studied B. japonicus populations.
Table 2. Genetic diversity parameters among 12 ISSR markers for all 24 B. japonicus populations.
Table 3. Analysis of molecular variance (AMOVA) of B. japonicus based on ISSR.
Figure 1. (a) UPGMA dendrogram of the analyzed populations generated from ISSR data and estimated according to the [Citation26] formula. (b) Population-based cluster analysis using STRUCTURE for K = 4 based on ISSR data. Samples from east of China(cluster IV); samples from middle of China(cluster III); samples from west of China(cluster II); samples from west of China (cluster I). The distribution of the populations to different groups is indicated by color (G1: green, G2: red, G3: yellow, G4: blue).
![Figure 1. (a) UPGMA dendrogram of the analyzed populations generated from ISSR data and estimated according to the [Citation26] formula. (b) Population-based cluster analysis using STRUCTURE for K = 4 based on ISSR data. Samples from east of China(cluster IV); samples from middle of China(cluster III); samples from west of China(cluster II); samples from west of China (cluster I). The distribution of the populations to different groups is indicated by color (G1: green, G2: red, G3: yellow, G4: blue).](/cms/asset/3a9563c1-d0f3-4220-8bd1-ea8a22561ca2/tbeq_a_2326810_f0001_c.jpg)
Figure 2. Geographical distribution in China of 15 cpDNA haplotypes in B. japonicus (Pie charts shows the different haplotypes with their proportions).
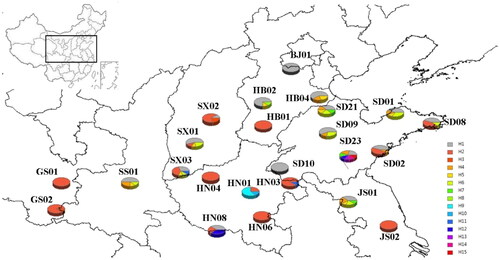
Table 4. The analysis of molecular variance (AMOVA) of B. japonicus based on two chloroplast DNA sequences.
Figure 3. Divergence dating of fifteen cpDNA haplotypes in B. japonicus based on MP coalescence analysis.
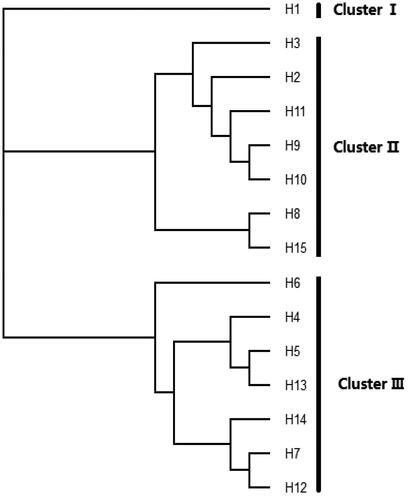
Figure 4. Haplotype network of B. japonicus (Size of the circle is the proportional to the relative frequency of the haplotypes).
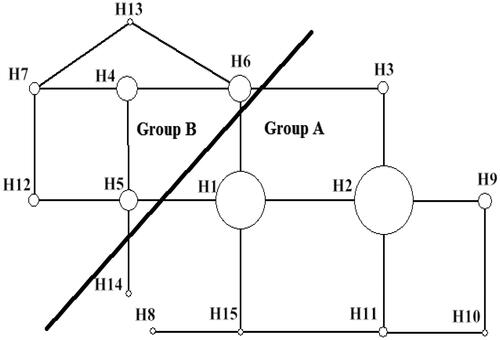
Figure 5. Population-based cluster analysis using STRUCTURE for K = 3 based on cpDNA data.
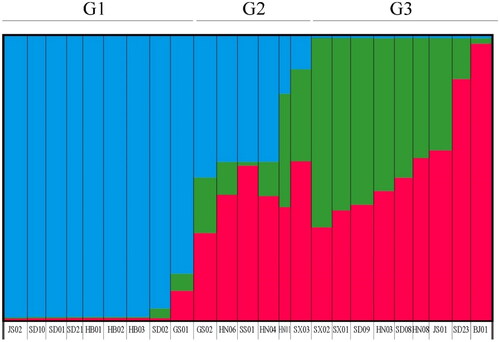
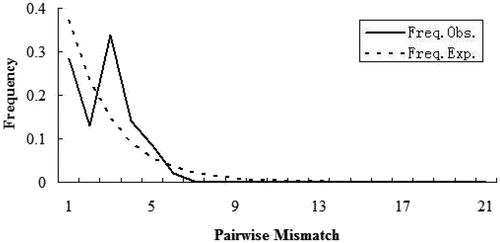
Figure 6. Mismatch distribution established of B. japonicus (Thin line represents the observed mismatch distribution; the dotted line represents the expected mismatch distribution).
Supplemental Material
Download PDF (813.2 KB)Data availability statement
The data that support the findings of this study are available on request from the corresponding authors.