
Figures & data
Table 1. Distribution of mesothelial patients according to demographic, histopathological and immunohistochemical characteristics.
Figure 1. HEG1 expression in malignant mesothelioma subtypes. (A) Strong HEG1 expression in high-grade epithelioid malignant mesothelioma (immunoperoxidase, 100X). (B) Biphasic mesothelioma; strong HEG1 expression (arrow) in epithelioid areas, weak HEG1 expression (star) in sarcomatoid areas (immunoperoxidase, 100X). Scale bar = 500 µm.
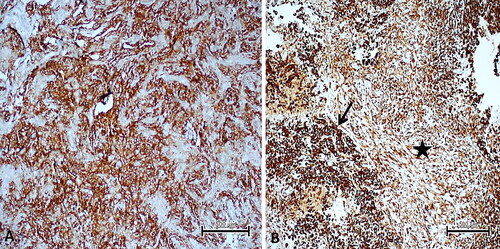
Table 2. HEG1 Expression status according to tumor types.
Table 3. VISTA and PD-L1 ımmunoreactivity in mesothelial lesion subgroups.
Figure 2. VISTA and PD-L1 expression levels in malignant mesothelioma subtypes. (A) Strong membranous VISTA expression in epithelioid mesothelioma (immunoperoxidase, 100X). (B) Biphasic mesothelioma: Strong VISTA expression (arrow) in epithelioid areas, VISTA negative (star) in sarcomatoid areas (immunoperoxidase; 100X) C. Strong membranous PD-L1 positivity in sarcomatoid mesothelioma (immunoperoxidase, 100X). (D) Focal, weak PD-L1 positivity (arrow) in biphasic mesothelioma (immunoperoxidase, 100X). Scale bar = 500 µm.
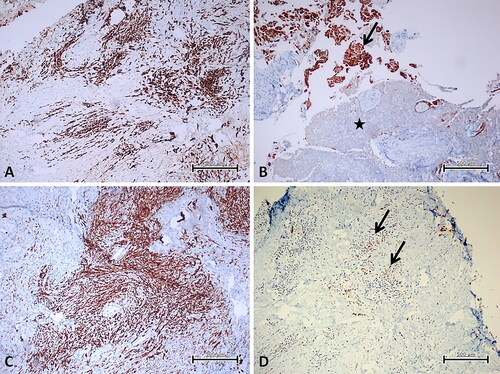
Table 4. The state of VISTA and PD-L1 expressions in epithelioid malignant mesotheliomas according to the histological degree.
Table 5. Comparison of VISTA and PD-L1 expressions in mesothelial lesions.
Data availability statement
The data that support the findings of this study are available from the corresponding author, [UA], upon reasonable request.