
Figures & data
Figure 1. Chemiluminescent calibration curve in the range 10, 5, 2.5, 1.25, 0.625, 0.3125 pmol ATP (A) and 1.25, 0.625, 0.3125 pmol ATP and the calculation of the results according to the linear equation (B).
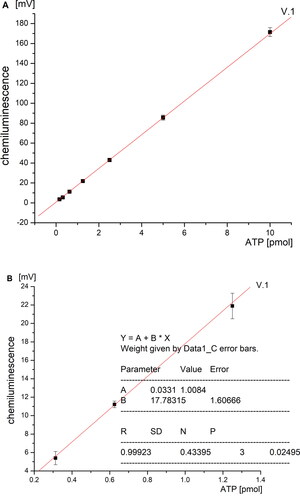
Table 1. Concentrations of ATP [pmol] in different ampoules of two BCG vaccine samples.
Table 2. Number of culturable particles (NCP) × 106/mL.
Data availability statement
The data are available on request from the corresponding author [E.P.] upon reasonable request.