
Figures & data
Table 1. Information on selected fungal strains in this study.
Table 2. Primers and TaqMan probes designed in this study.
Table 3. DNA extraction kits used for the extraction of DNA from conidia.
Figure 1. Screening and optimization of D. citri primers. (A) Specific amplification via the primers DcitTUB-F/DcitTUB-R for D. citri; agarose gel electrophoresis parameters: 25 min, 110 V, 1.5% agarose gel. M: DL2000 DNA Marker (TaKaRa, Dalian Co., Ltd.); Lanes 1–3: D. citri; Lane 4: Colletotrichum gloeosporioides; Lane 5: C. gloeosporioides; Lane 6: D. lithocarpus; Lane 7: Diplodia natalensis Evans; Lane 8: Guignardia citricarpa; Lane 9: D. nobilis; Lane 10: Asymptomatic citrus leaves. (B) Curves for determination of the optimal annealing temperature for the primer pair DcitTUB-F/DcitTUB-R.
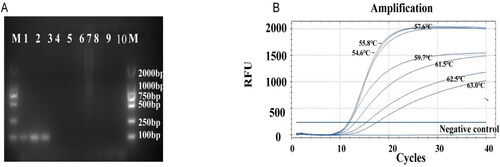
Figure 2. Analysis of the LOD and LOQ of the plasmid standard DNA using the curve-fitting modelling approach. (A) Calibration curve plot of Cq values vs. standard concentrations. (B) LOQ plot with Coefficient of variation (CV) vs. standard concentrations.
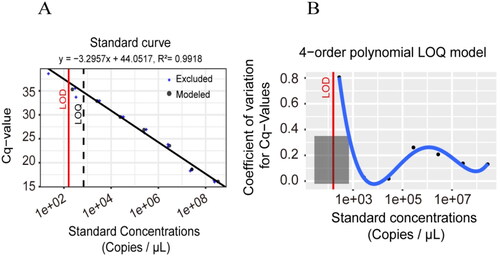
Table 4. Comparison of different methods for the extraction of DNA from fungal conidia.
Figure 3. Linear regression of the log10(conidia number) against Cq values.
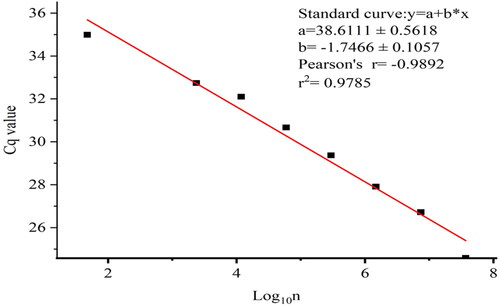
Figure 4. TaqMan qPCR detection of leaf samples with symptoms of citrus melanose and airborne conidia from an orchard. A and B: positive control; C–H: leaf samples; I and J: airborne conidia captured using a TPBZ3 conidia trap in a citrus orchard; K: ddH2O; L and M: airborne conidia captured using a TPBZ3 conidia trap in a tea garden.

Data availability statement
All data that support the findings reported in this study are available from the corresponding author(Z.D.H.)upon reasonable request.