
Figures & data
Table 1. Measurements of Central tendency and spread, and statistical inference of the self-reported pain levels, reported at different time points (3rd, 6th, 24th hour) after the first and second surgical extractions.
Table 2. Statistically significant differences between the pain score (in points) reported at the three time points (3rd, 6th, 24th hours) by surgical procedure and medication group.
Figure 1. Box-plot diagram of the pain by time point, visit, medication therapy and difficulty of the molar extraction.
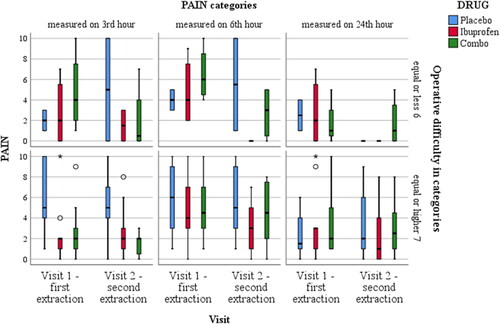
Figure 2. Network architecture.
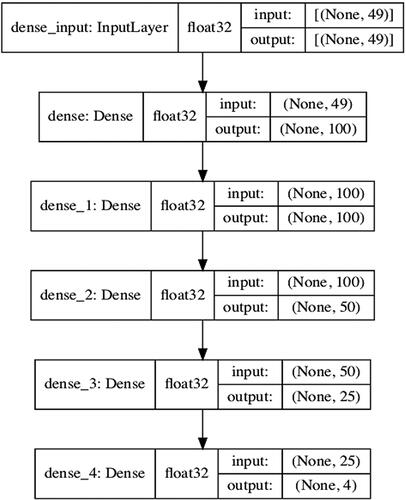
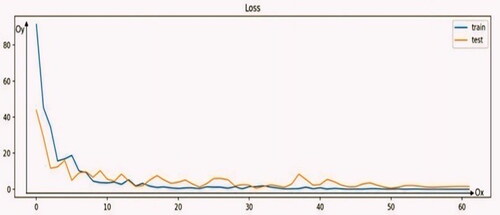
Figure 3. The loss function.
Data availability statement
The data that support the findings of this study are available from the corresponding author, upon reasonable request.