
Figures & data
Figure 1. Characterization of biogenically synthesized AgNPs: (a) transmission electron microscopy (TEM); (b) Fourier transmission infrared (FTIR) spectroscopy (transmittance versus wavenumber); (c) UV-visible spectrum (absorbance versus wavelength; (d) zeta potential (total count versus apparent zeta potential).
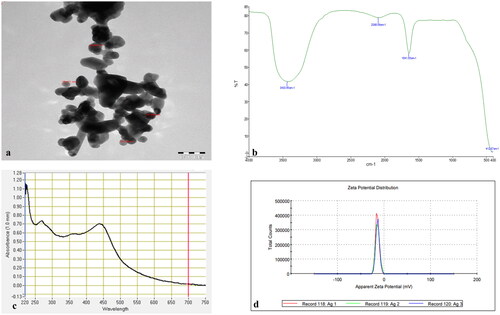
Figure 2. Percentage seed germination of E. macrochaetus; C (Control, distilled water); Ag-40 (40 µmol/L AgNPs); Ag-80 (80 µmol/L AgNPs); Ag-160 (160 µmol/L AgNPs); Ag-300 (300 µmol/L AgNPs); Ag-400 (400 µmol/L AgNPs); NaCl-40 (40 mmol/L NaCl); NaCl-80 (80 mmol/L NaCl) and NaCl-120 (120 mmol/L NaCl). The percentage germination was determined on day 7 after sowing.
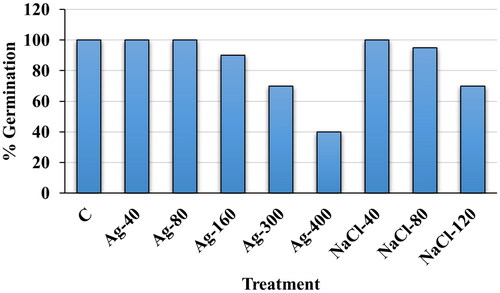
Figure 3. Plumule and radicle lengths in germinated seeds of E. macrochaetus; (a) Control; (b) 40 µmol/L AgNPs; (c) 80 µmol/L AgNPs; (d) 160 µmol/L AgNPs; (e) 300 µmol/L AgNPs; (f) 400 µmol/L AgNPs; (g) 40 mmol/L NaCl; (h) 80 mmol/L NaCl; (i) 120 mmol/L NaCl. Note: Seed priming with AgNPs (24 h) and unprimed seeds germinated under salt solution (seven days). Pictures were taken on the seventh day after sowing.
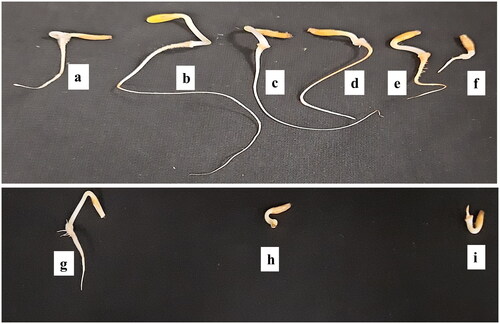
Figure 4. Effect of biogenic AgNPs and NaCl on plumule and radicle lengths in seed germination study. C (Control, distilled water); Ag-40 (40 µmol/L AgNPs); Ag-80 (80 µmol/L AgNPs); Ag-160 (160 µmol/L AgNPs); Ag-300 (300 µmol/L AgNPs); Ag-400 (400 µmol/L AgNPs); NaCl-40 (40 mmol/L NaCl); NaCl-80 (80 mmol/L NaCl) and NaCl-120 (120 mmol/L NaCl); data are means of three replicates (mean ± SD). Different letters on bar graph indicate significant differences (p < .05). Note: Measurements were made on the seventh day after sowing.
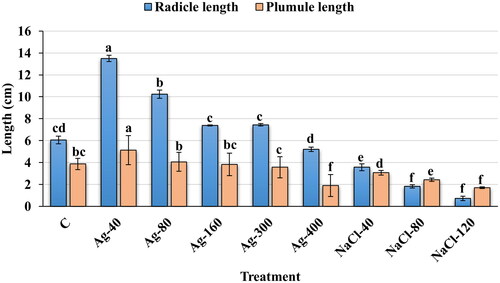
Figure 5. Morphological characteristics of E. macrochaetus with AgNPs and NaCl treatment in pot experiment; (a) T1p (Control, distilled water); (b) T2p (40 µmol/L AgNPs); (c) T3p (80 µmol/L AgNPs); (d) T4p (40 mmol/L NaCl); (e) T5p (80 mmol/L NaCl); (f) T6p (120 mmol/L NaCl); (g) T7p (40 mmol/L NaCl + 40 µmol/L AgNPs); (h) T8p (80 mmol/L NaCl + 40 µmol/L AgNPs); (i) T9p (120 mmol/L NaCl + 40 µmol/L AgNPs); (j) T10p (40 mmol/L NaCl + 80 µmol/L AgNPs); (k) T11p (80 mmol/L NaCl + 80 µmol/L AgNPs); (l) T12p (120 mmol/L NaCl + 80 µmol/L AgNPs). Note: Treatment duration was 90 days and photographs were taken after 120 days of sowing.
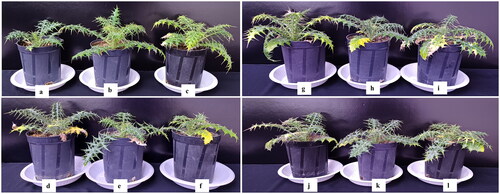
Table 1. Effect of biogenic AgNPs alone and in combined treatment (AgNPs + NaCl) on biomass of different parts of E. macrochaetus.
Table 2. Proline content, total chlorophyll and antioxidant enzyme activities (APX and GR) in treated (AgNPs and NaCl) and untreated plants of E. macrochaetus.
Figure 6. Histogram display of DNA content from leaves of E. macrochaetus measured by flow cytometry. Figures and their corresponding treatments; (a) T1p (Control, distilled water); (b) T2p (40 µmol/L AgNPs); (c) T3p (80 µmol/L AgNPs); (d) T4p (40 mmol/L NaCl); (e) T5p (80 mmol/L NaCl); (f) T6p (120 mmol/L NaCl); (g) T7p (40 mmol/L NaCl + 40 µmol/L AgNPs); (h) T8p (80 mmol/L NaCl + 40 µmol/L AgNPs); (i) T9p (120 mmol/L NaCl + 40 µmol/L AgNPs); (j) T10p (40 mmol/L NaCl + 80 µmol/L AgNPs); (k) T11p (80 mmol/L NaCl + 80 µmol/L AgNPs); (l) T12p (120 mmol/L NaCl + 80 µmol/L AgNPs).
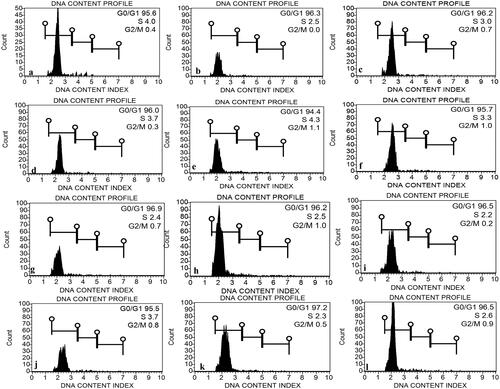
Table 3. Assessment of genotoxicity in E. macrochaetus exposed to NaCl stress and biogenic AgNPs.
Data availability statement
The data supporting the findings of the present study are available in this article and are accessible from corresponding author upon reasonable request.