
Figures & data
Table 1. TrGRAS Genes identified in the white clover genome.
Figure 1. Phylogenetic analysis of the TrGRAS genes in white clover.
Note: The molecular phylogeny of TrGRAS genes in white clover. Red solid circles represent DELLA subfamily; wine red solid triangles represent SCR subfamily; yellow hollow rectangles represent HAM subfamily; blue solid rectangles represent LISCL subfamily; aurantiacus solid diamonds represent SHR subfamily; pink solid triangles represent PAT1 subfamily; green hollow circles represent DLT subfamily; blue hollow rectangles represent SCL3 subfamily; and cyan hollow rectangles represent Os4 subfamily.
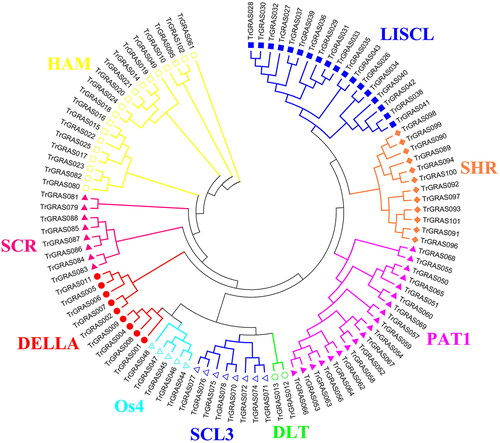
Figure 2. Distribution of conserved motifs in TrGRAS genes.
Note: The conserved motifs in TrGRAS genes were identified and characterized using MEME software. Each colored box represents the putative motifs detected in the protein sequence.
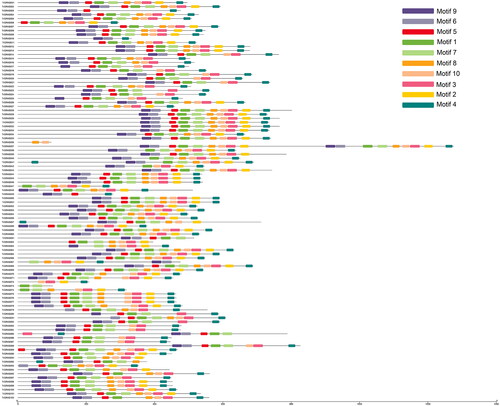
Figure 3. Chromosomal distribution and gene duplication analysis of the TrGRAS genes in white clover.
Note: All gene duplications were identified using MCSanX software, and they were displayed using CIRCOS software. All TrGRAS genes are labeled with red short line, and genes with duplication event are linked with black curve.
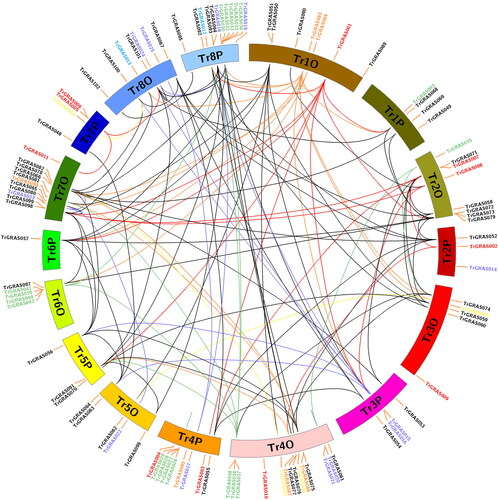
Figure 4. Gene regulatory network analysis of TrGRAS genes in white clover.
Note: Gene regulatory network of white clover was reconstructed using Arabidopsis gene regulatory network (GRN) from AraNet database. The pink nodes are TrGRAS genes, and the light blue nodes are functional genes interacting withTrGRAS genes in white clover.
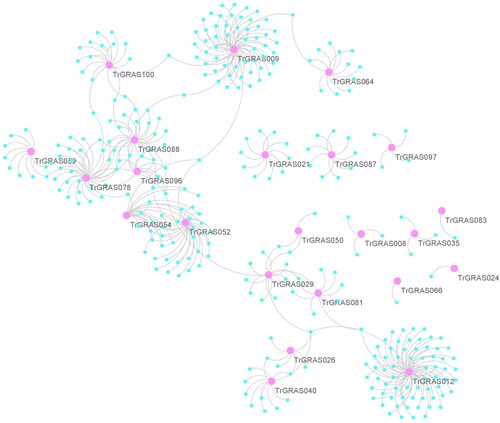
Figure 5. GO analysis of gene regulatory networks of TrGRAS genes in white clover.
Note: GO enrichment analysis was performed using topGO package. Red dot BP, green dot MF and blue dot CC represent three types of GO terms, including biological process (BP), molecular function (MF) and cellular component (CC). The dot size represents the number of genes enriched in the GO term. The ordinate is the term of GO, and the abscissa is the p-value of topGO enrichment analysis, −log10 (p).
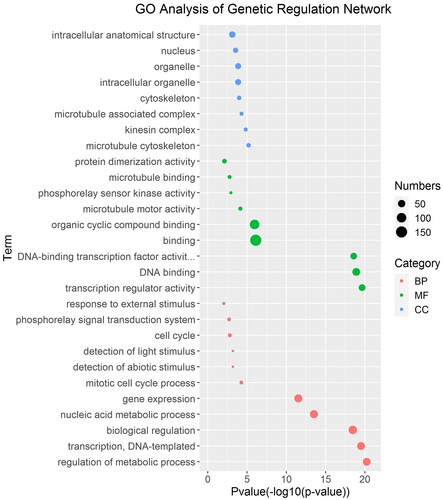
Figure 6. Expression profile of TrGRAS genes in white clover under cold stress.
Note: The expression levels of TrGRAS genes were collected from the NCBI SRA database (accession number PRJNA781064) and all expression data were clustered and plotted using the function heatmap in R platform.
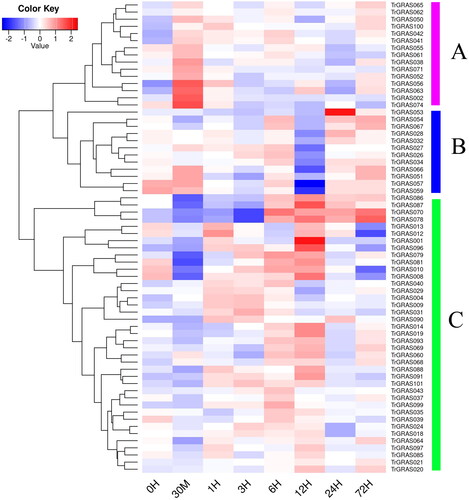
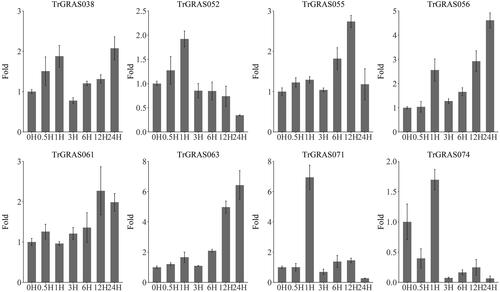
Figure 7. qRT-PCR analysis of TrGRAS genes in white clover under cold stress.
Note: The X-axis represents time points in response to cold stress, and the Y-axis represents relative expression levels of TrGRAS genes. The housekeeping genes are Action and GAPDH.
Supplemental Material
Download Zip (563.6 KB)Data availability statement
The data that support the findings reported in this study are available from the corresponding author [YS] upon reasonable request.