
Figures & data
Figure 1. PCR amplification analysis of the CaAPRR2-like gene in B1-2 and D50. (A) PCR amplification of CaAPRR2-like from gDNA. M: DL5000 DNA marker. (B) PCR amplification of CaAPRR2-like from cDNA. M: DL2000 DNA marker. PCR products were separated in a 2% agarose gel.
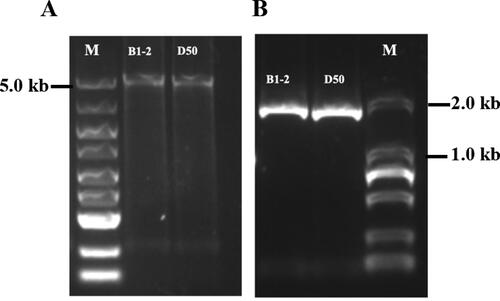
Figure 2. Multiple sequence alignment analysis of CaAPRR2-like cDNA from B1-2, D50 and the reference genome. (A) The mutation site in cDNA sequence extracted from B1-2. The red box represents a single base deletion (G) at site 901 of the B1-2 sequence, and 00 represents the reference genome sequence. (B) Structure and variation site pattern of CaAPRR2-like gene. The boxes represent the exon regions; the black line represents the intron region; the numbers 1–11 indicate the position of the exon region; the black arrow indicates the site of the single base deletion in the B-12 sequence. (C) Alignment analysis of AA sequences from B1-2 and D50.
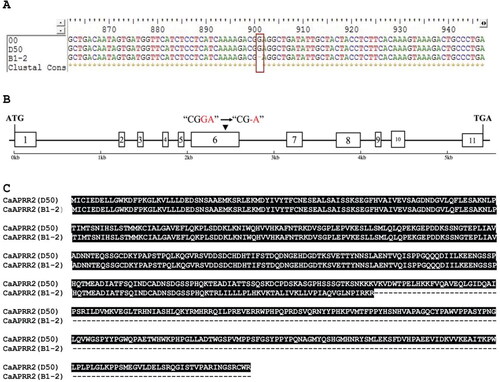
Figure 3. Polymorphic bands obtained by TaqI restriction endonuclease digestion. M: DL2000 DNA marker.
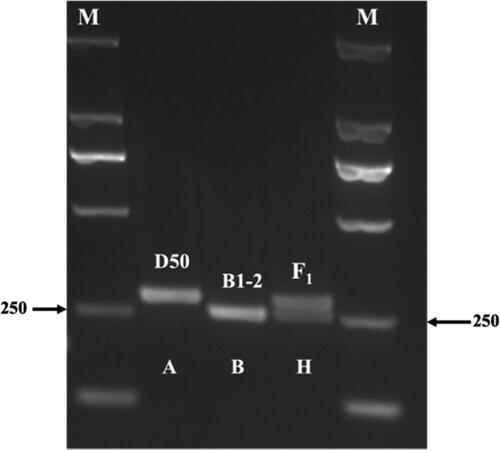
Figure 4. Polymorphic bands obtained from TaqI restriction endonuclease digestion in F2 segregation population. M: DL500 DNA marker; a: polymorphic band of B1-2; b: polymorphic band of D50; c: polymorphic band of F1.
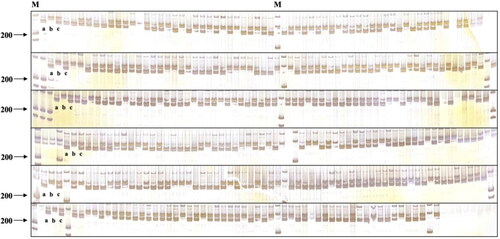
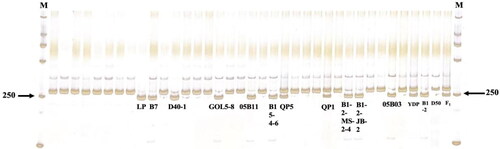
Figure 5. Results of digestion of dCAPS-tagged APRR2-d on 34 white-fruited peppers. M: DL2000.
Supplemental Material
Download MS Word (200.7 KB)Data availability statement
Data that support the findings reported in this study will be available upon request.