
Figures & data
Table 1. Gene-specific Primers used for gene expression analysis by quantitative real-time PCR.
Figure 1. Constitutive expression of ZmPGIP1 in Arabidopsis.
(A) Amplification of the Zea mays PGIP1 gene (ZmPGIP1). M: DL marker 2,000. (B) Structure of the pCAMBIA2300 binary vector harboring ZmPGIP1 under the control of the 35S promoter. 35S, CaMV 35S promoter; KpnI and XbaI indicate restriction sites; KanR, kanamycin resistance gene; LacZa, LacZa expression cassette for blue-white spot screening. (C) PCR identification of T2 transgenic Arabidopsis. M: DL marker 2,000; the other lanes are the transgenic lines #2, #5, #10, #11, #12, #15 (T2 generation). (D) Expression of ZmPGIP1 mRNA in the control and transgenic Arabidopsis lines #2, #11 and #12 (homozygous transgenic lines, T3 generation). The mRNA abundance of ZmPGIP1 in the control line (empty vector) with ACTIN2 as the internal control was set to 1. ACTIN2 is used as a control for normalization. Data are average values ± SD from three independent experiments. Independent-Samples T Test, *P < 0.05.
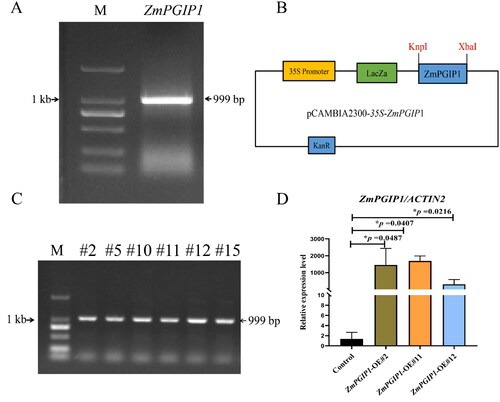
Figure 2. Subcellular localization of ZmPGIP1 in onion epidermal cells.
(A) Transient expression of 35S:ZmPGIP1:eGFP. (B) Transient expression of 35S:eGFP in onion epidermal cells. eGFP, GFP fluorescence; Merged, merged image of eGFP and bright field. Scale bars = 100 μm. 35S:eGFP as a control.
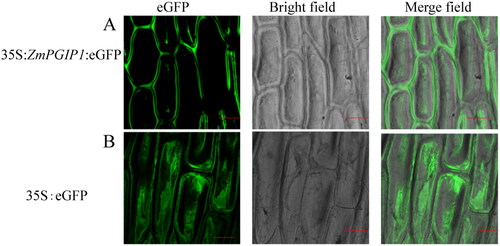
Figure 3. Specific PG enzyme activities of wild-type (WT) and transgenic Arabidopsis.
The seedlings were cultured for 8 weeks. WT, wild type; #2 and #11, ZmPGIP1 overexpression lines; PG, polygalacturonase. Data are means ± SD (n = 10). ***P < 0.001, independent-samples t-test.
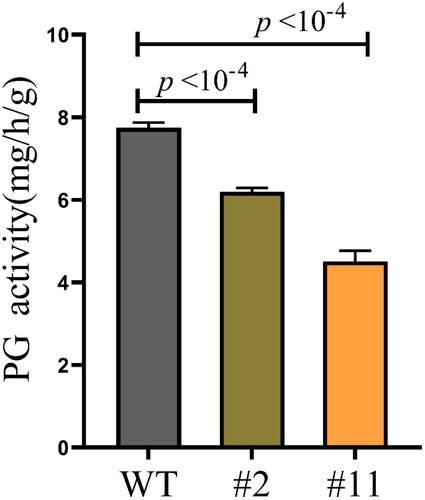
Figure 4. Microscopic observation of wild-type (WT) and ZmPGIP1-overexpressing Arabidopsis.
(A, D) Phloroglucinol staining in cross-sections of WT and ZmPGIP1-transgenic Arabidopsis. (B, E) Phloroglucinol staining in longitudinal sections of WT and ZmPGIP1-transgenic Arabidopsis. (C) Saffron staining in longitudinal paraffin-embedded sections of wild-type Arabidopsis. (F) Saffron staining in longitudinal paraffin-embedded sections of transgenic Arabidopsis. WT, wild type; Scale bar is 100 µm.
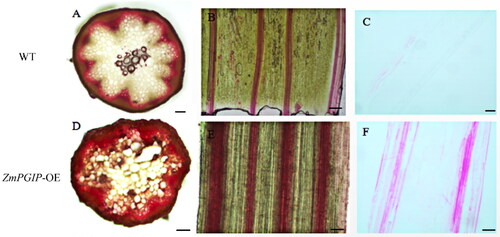
Table 2. Determination of the main G and S monomers released by the lignin of stems of transgenic Arabidopsis.
Figure 5. Ultrastructural analysis of wild-type (WT) and transgenic Arabidopsis stems.
(A) Ultrastructural morphology of cell wall of ZmPGIP1 transgenic seedlings. (B) Ultrastructural morphology of cell wall of WT seedlings. Scanning electron microscope images of 8-week-old WT and #11 Arabidopsis stems were used to obverse. #11, ZmPGIP1 overexpression lines. Red arrow, blue arrow and yellow arrow represent cuticle, cortex and parenchyma cells, respectively. Scar bars are 100 µm and 10 µm.
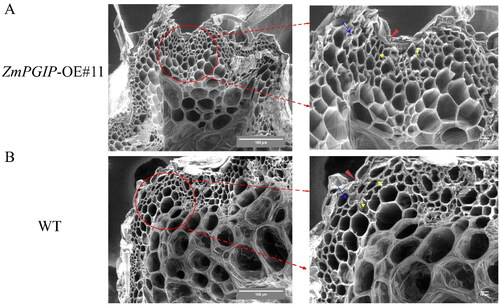
Figure 6. Effect of cell wall components in the wild-type (WT) and heterologous expression ZmPGIP1 transgenic Arabidopsis plants.
(A) Cellulose content in the inflorescence stems from the WT and transgenic Arabidopsis. (B) Hemicellulose content in the inflorescence stems from the WT and transgenic Arabidopsis. (C) Lignin content in the inflorescence stems from the WT and transgenic Arabidopsis. (D) Covalently bonded pectin content in the inflorescence stems from the WT and transgenic Arabidopsis. 5-week-old T3 generation transgenic Arabidopsis plants heterologously expressing the ZmPGIP1 gene were used for analysis. Results represent at least three independent biological repetitions. WT, wild type; #2, #11 and #12, ZmPGIP1 overexpression lines; CSP, covalently bonded pectin. Independent-Samples T Test, *P < 0.05, **P < 0.01, ***P < 0.001, ns represents no significance at P > 0.05.
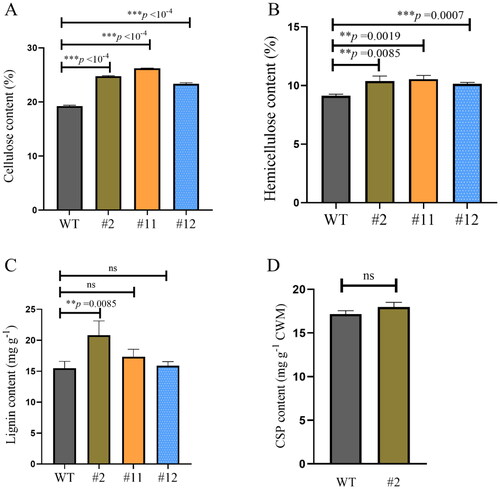
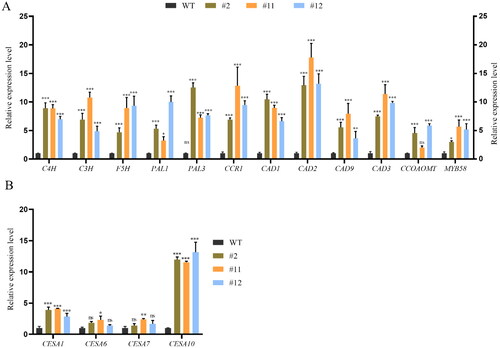
Figure 7. Quantitative real time RT-PCR to assess core genes involved in lignin and cellulose synthesized-related genes in ZmPGIP1 transgenic Arabidopsis.
(A) Relative transcript levels of lignin synthesized-related genes in WT and transgenic Arabidopsis seedlings. (B) Relative transcript levels cellulose synthesized-related genes in WT and transgenic Arabidopsis seedlings. C4H: Cinnamate 4-hydroxylase, CCR: Cinnamic acylcoenzymea, CAD: Cinnamoyl alcohol dehydrogenase, F5H: Ferulic acid-5-hydroxylation, PAL: Phenylalanine ammonia-lyase, CCOAOMT: Coffee-phthalocyanine coenzyme A-O-methyltransferase, C3H: P-coumaroyl shikimate 3’-hydroxylase, MYB: V-myb avian myeloblastosis viral oncogene homolog, CESA: Cellulose synthases. The expression of the ACTIN2 gene was used as an internal control. Results represent at least three independent biological repetitions. Error bars indicate ± SD. Student’s t-test was used to compare the measurements of OE lines with those from wild type (WT). *P < 0.05, **P < 0.01, ***P < 0.001, ns represents no significance at P > 0.05.
Supplemental Material
Download PDF (518.1 KB)Data availability statement
The data that support the findings of this study are available from the corresponding authors Xian-wei Fan upon reasonable request.