
Figures & data
Figure 1. Antifungal activity of AMEP412 against M. oryzae. M. oryzae spore suspension was coated on an oat medium agar plate and incubated at 28 °C for 7 days. CK (control): 100 μL sterile distilled water, AMEP412: AMEP412 protein samples (0.05 mg/mL).
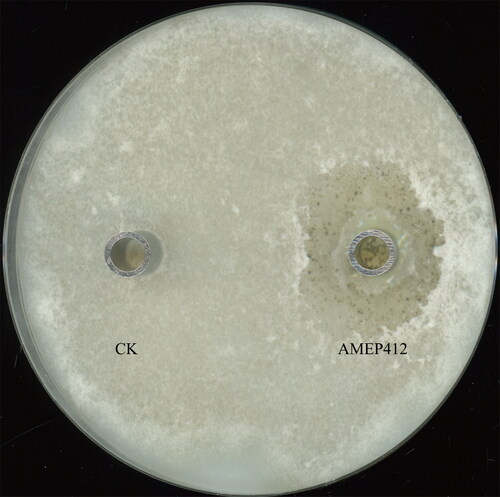
Figure 2. Inhibition of M. oryzae aerial hyphae growth by AMEP412. M. oryzae mycelium blocks were grown on complete medium agar plates containing different concentrations of AMEP412 at 28 °C for 5 days.
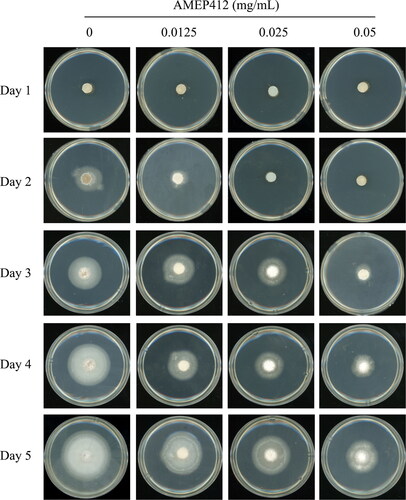
Table 1. Colony diameter (cm) of M. oryzae grown on complete medium containing different concentrations of AMEP412 at 28 °C for 5 days.
Table 2. Radial growth inhibition of M. oryzae after 5 days of incubation and EC50 value.
Figure 3. Inhibition of M. oryzae conidia development by AMEP412. M. oryzae mycelium blocks were grown on oat medium agar plates containing different concentrations of AMEP412 at 28 °C for 7 days. Growth phenotype (A); spore morphology (B). Scale bar = 20 μm. Deformed spores were indicated by black arrows. Data are mean values from three replicates with SD.
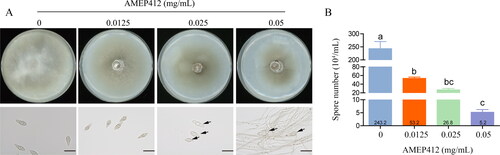
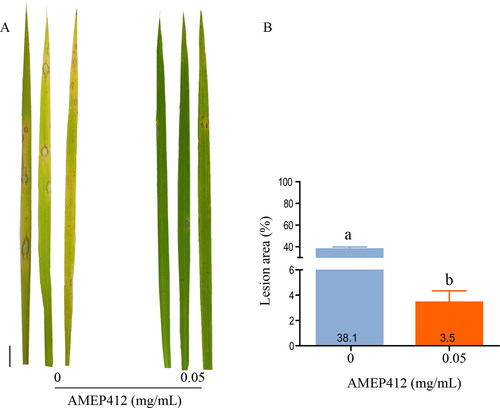
Figure 4. Inhibition of M. oryzae conidia pathogenicity by AMEP412. AMEP412 treated spores were inoculated on detached rice leaves and cultured at 28 °C for 7 days. Lesion symptoms on detached leaves (A); quantitative analysis of lesion area (B). Scale bar = 1 cm. Data are mean values from three replicates with SD.
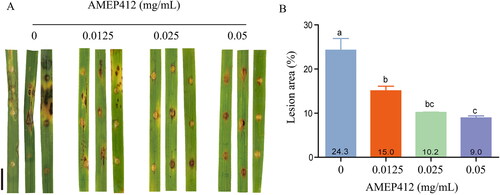
Figure 5. Fluorescence assays detecting the localization of AMEP412 on M. oryzae hyphae and conidia. Localization on hyphae (A); localization on spore (B). Scale bar = 10 μm.
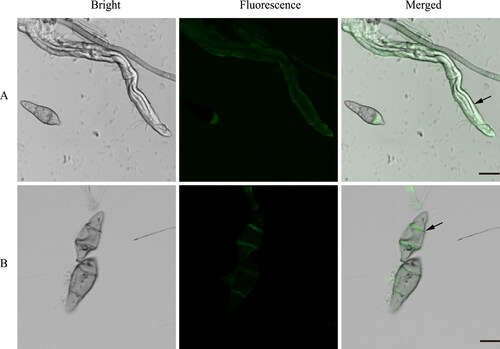
Figure 6. Spatial structure prediction of AMEP412 (WP_017418614.1) by AlphaFold2. Polymer structure in side view (A); polymer structure in vertical view (B); monomer structure showing charged amino acids (C); monomer structure showing hydrophobic amino acids (D).
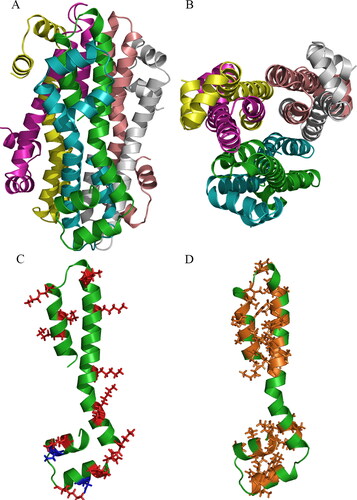
Figure 7. Biocontrol effect of AMEP412 against M. oryzae on rice seedlings. M. oryzae spore suspension was sprayed on rice seedlings and cultured at 28 °C for 7 days. Lesion symptoms on rice leaves (A); quantitative analysis of lesion area (B). Scale bar = 1 cm. Data are mean values from three replicates with SD.
Data availability statement
All data that support the findings of this study are available from the corresponding author (QW and QL) upon reasonable request.