
Figures & data
Figure 1. Sampling area of the Kiwifruit material.
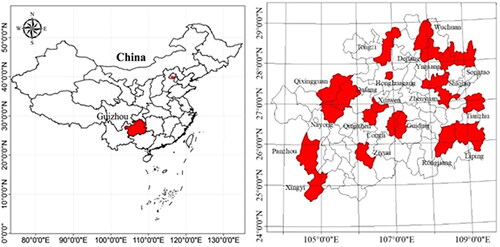
Table 1. Kiwifruit germplasm resources used in this study.
Table 2. The SRAP primers used in the test.
Table 3. SRAP primers used in this study and their polymorphisms.
Figure 2. Amplification map generated by several SRAP primers in No. 1–24 kiwifruit materials. M is DL2000 DNA marker (MD114, Tiangen, Beijing, China).
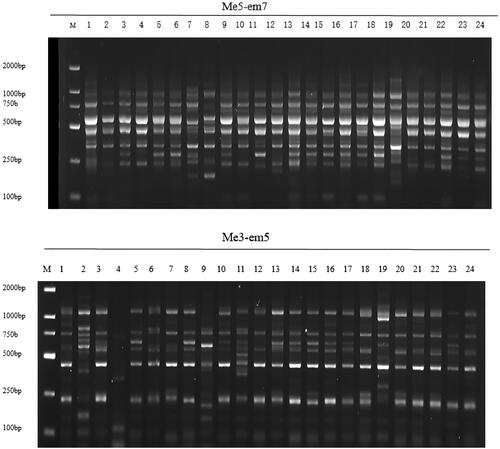
Figure 3. Dendrogram of 110 Actinidia germplasms based on SRAP markers.
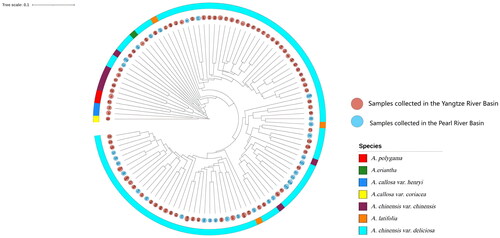
Figure 4. Structure analysis of individuals at K = 2. Evaluation value of ΔK (a); genetic structure diagram (b) of 110 accessions at K = 2.
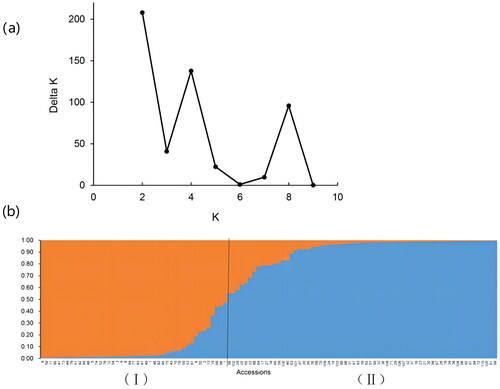
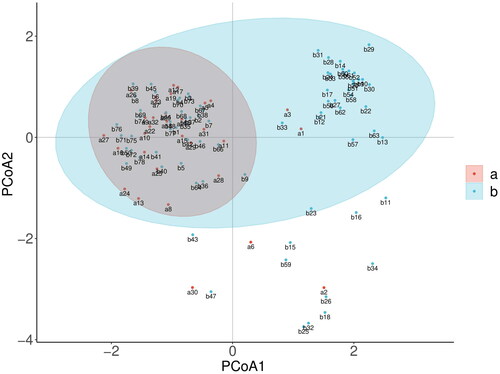
Figure 5. Distribution of 110 individuals by PCoA analysis. Pearl River Basin population (a), Yangtze River Basin population (b).
Data availability statement
All data are available from the corresponding author [WL] upon reasonable request.