
Figures & data
Figure 1. Visual analogue scale measuring the belief in guilt score.
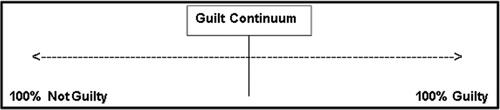
Figure 2. Line plots of average guilt scores at Timepoints 1 to 11 for weak-first (dashed line) and strong-first (solid line) evidence anchor condition. The corresponding shaded areas denote ±1 SE around the mean.
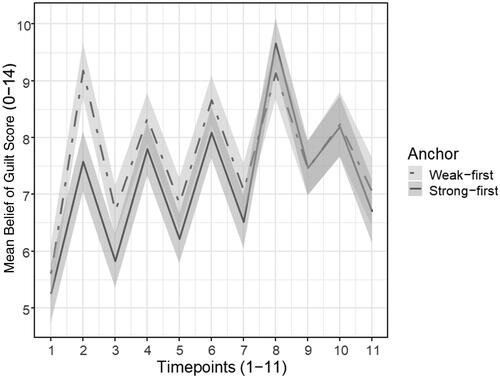
Table 1. Minimum and maximum scores for each of the constructs within the PJAQ.
Table 2. Descriptive statistics for each of the constructs within the PJAQ.
Table 3. Final belief of guilt scores grouped by evidence anchor and vignette.
Table 4. Verdict frequency within the evidence anchor, verdict systems and vignette predictor variables.
Supplemental material