2,139
Views
1
CrossRef citations to date
0
Altmetric
Articles

Burnout, work engagement and workaholism in a group of Dutch judges: distinctiveness and two-year structural stability

ORCID Icon, ORCID Icon & ORCID Icon

Figures & data

Table 1. Means, standard deviations and intercorrelations of variables.

Figure 1. Burnout, work engagement and workaholism: distinctiveness and 2-year structural stability. Note. **p < .01. ***p < .001. N = 118. This structural equation model shows the distinctiveness and the stability of the constructs in one model over 2 years. Values represent standardized regression coefficients. BU = burnout; EN = work engagement; W = workaholism; EX = exhaustion; CY = cynicism; PE = professional efficacy; VI = vigor; DE = dedication; AB = absorption; WE = working excessively; WC = working compulsively. The dotted lines represent non-significant relationships between professional efficacy and the latent factor burnout. Bold lines reflect loadings of the dimensions on the ‘wrong’ factor.

Figure 1. Burnout, work engagement and workaholism: distinctiveness and 2-year structural stability. Note. **p < .01. ***p < .001. N = 118. This structural equation model shows the distinctiveness and the stability of the constructs in one model over 2 years. Values represent standardized regression coefficients. BU = burnout; EN = work engagement; W = workaholism; EX = exhaustion; CY = cynicism; PE = professional efficacy; VI = vigor; DE = dedication; AB = absorption; WE = working excessively; WC = working compulsively. The dotted lines represent non-significant relationships between professional efficacy and the latent factor burnout. Bold lines reflect loadings of the dimensions on the ‘wrong’ factor.

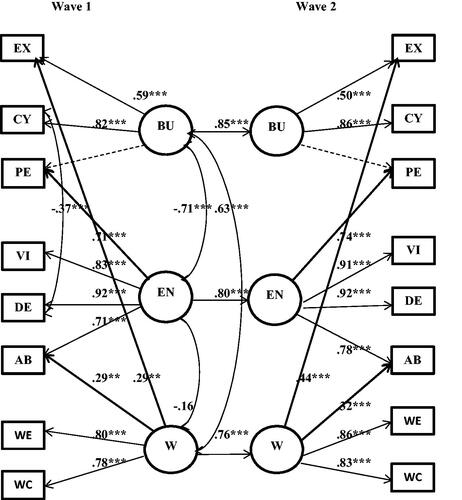
Table 2. Goodness-of-fit indices of the models, concerning burnout, work engagement and workaholism.