
Figures & data
Table 1. Mock trials for mock jurors.
Table 2. Number and percentage of convictions and acquittals for the Scottish three-verdict and Anglo-American two-verdict system.
Figure 1. Funnel plot of odds ratios (log scale) centred on the odds ratio estimate 0.59 (vertical line) with standard errors (SE) of estimates on the y-axis. The number above each black data point refers to the corresponding mock trial.
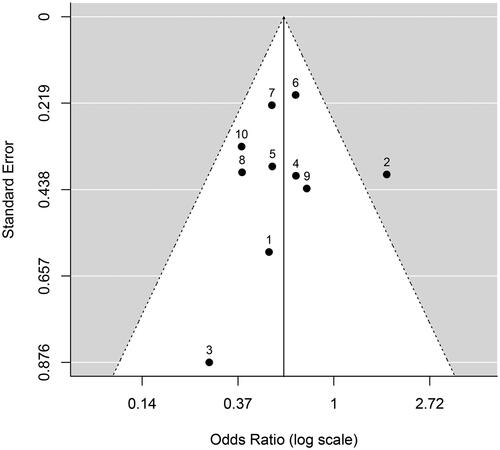
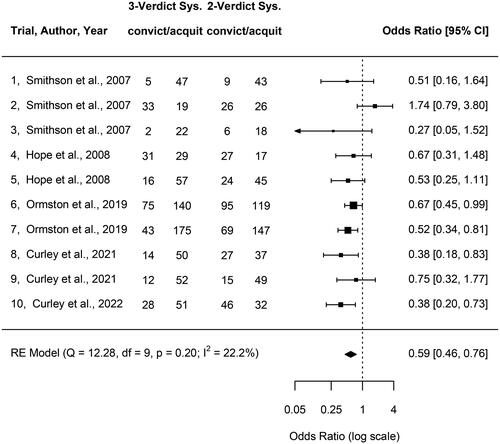
Figure 2. Forest plot of estimated odds ratios for 10 studies and mock trials based on a logistic model with random effects (Viechtbauer, Citation2010). CI = confidence interval. An odds ratio below 1.0 indicates a lower number of convictions for the 3-verdict system than for the 2-verdict system (see text for details).
Supplemental material