
Figures & data
Figure 1. Sequence index plot for clusters of employment trajectories after first birth (KLIPS 1998–2019). Note: Cluster size (1) 30.21%, (2) 16.06%, (3) 14.84%, (4) 14.16%, (5) 14.08%, (6) 10.65%.
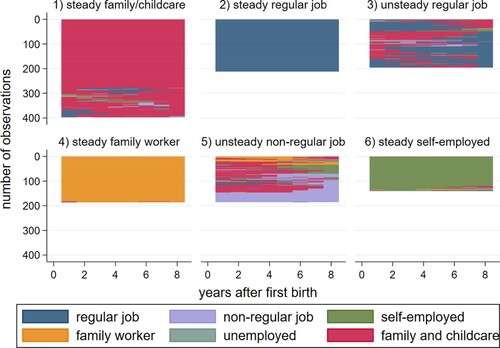
Table 1. Average number of years in different states in the eight years after first birth by clusters of employment trajectories and within cluster heterogeneity (entropy), (KLIPS 1998–2019).
Figure 2. Percentage plot for clusters of employment trajectories after first birth (KLIPS 1998–2019). Note: Cluster size (1) 30.21%, (2) 16.06%, (3) 14.84%, (4) 14.16%, (5) 14.08%, (6) 10.65%.
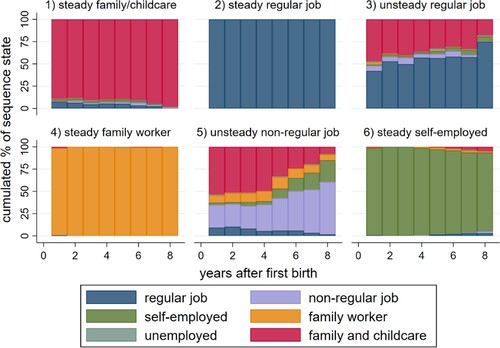
Table 2. Average marginal effects (AME) obtained from multinomial logistic regression for the predicted probability of cluster membership (KILPS 1998–2019).
Figure 3. Sequence index plot for clusters of monthly employment trajectories 12 months before and 36 months after first birth (KLIPS 1998–2019). Note: The red line illustrates the month of first childbirth. Cluster size (1) 29.4%, (2) 23.5%, (3) 22.4%, (4) 11.5%, (5) 8.3%, (6) 4.9%.
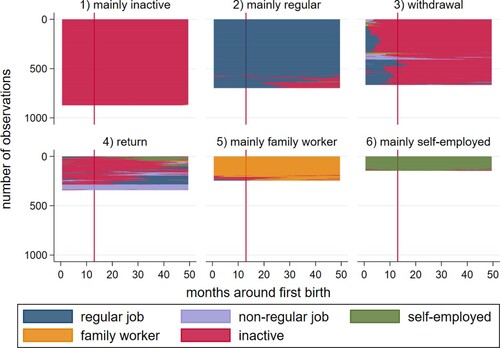
Table A1. Descriptive statistics by women’s (non-)employment pathways (KLIPS 1998–2019).
Data availability statement
The data that support the findings of this study are available from the Korean Labor Institute. Restrictions apply to the availability of these data, which were used under license for this study. Data supporting the findings of this study are available from the authors with the permission of the Korean Labor Institute.