
Figures & data
Table 1. Paternity benefit policy.
Table 2. Percentage of private companies offering occupational top-ups.
Figure 1. Paternity Benefit take-up rates by quarter.
Source: (CSO, Citation2019; Citation2020, table 5; DEASP, Citation2018; DSP, Citation2021; Eurostat, Citation2021). Notes: own calculations see A.1. Crude rate = claimants / number of births. Adjusted rate = claimants / (employment rate * number of births). Eligibility rate = eligible fathers are the reversed non-take-up rate. Target population are male workers with sufficient social insurance record aged 15-44. Gender rate = paternity claimants / maternity claimants. *Q4 2016 includes September claimants. ^ rate refers to annual data.
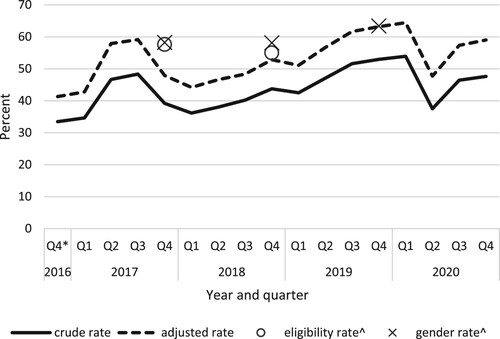
Figure 2. Variability of take-up by industrial activity, eligibility rate.
Source: own calculations, 14 sectors considered (CSO, Citation2020).
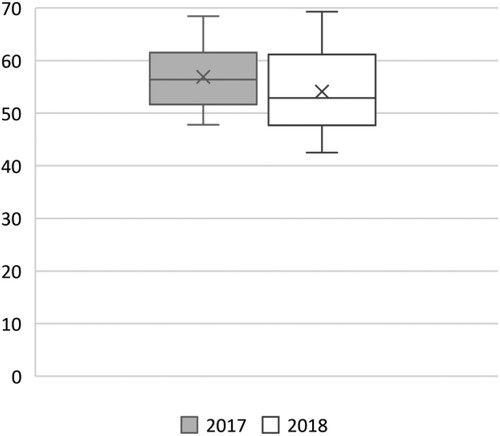
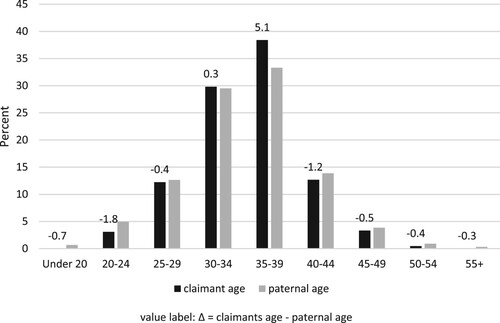
Figure 3. Age distribution of claimants and fathers at birth of child, 2017.
Source: (CSO, Citation2018a; DEASP, Citation2018) Notes: Own calculation. Paternal age: Fathers age unknown not displayed (3%), N=62,053. Claimants: recipients on 31 Dec 2017, N=875, No claimants under 20 and 55+ reported. Value label shows percentage point difference between claimants and paternal age.
Supplemental Material
Download PDF (207.3 KB)Data availability statement
Almost all data used is publicly available and all sources and indicators are detailed in the supplementary data file. Moreover, the data table in A.1 contains the raw data and derived indicators for . The Ibec reports used are only accessible to members and to researchers on request and, therefore, the data cannot be shared.