
Figures & data
Figure 1. Map of the location of the three study sites along the coastline of Perth, Western Australia (Drawn from Google Maps Citation2022). Letters identify habitat zones: B bare; S outer Sargassum; IP inner platform with diverse algae; IS inner Sargassum; E Ecklonia.
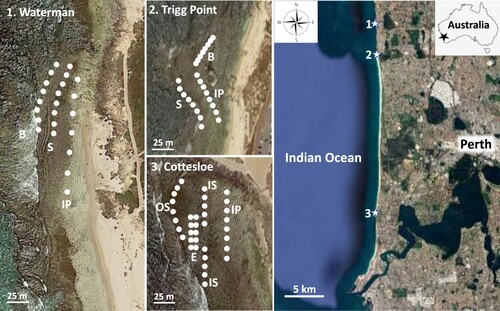
Table 1. Numbers of temperate, tropical and WA endemic species identified on three Perth coastal platforms in surveys taken between 1983 and 2021.
Figure 2. Species richness and diversity indices of molluscs on three intertidal limestone platforms in the Perth metropolitan area from 1983 to 1987, and in 2007 and 2021.
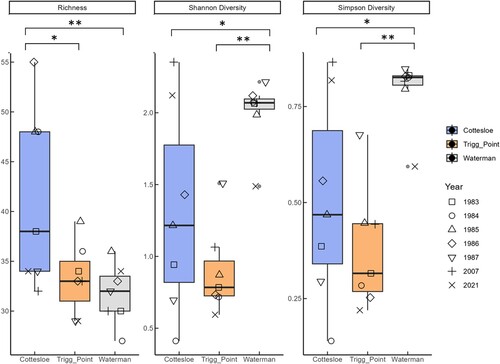
Figure 3. Total mean density of molluscs (3A) and the mussel Brachidontes ustulatus (3B) on three intertidal limestone platforms in the Perth metropolitan area from 1983 to 1987, and in 2007 and 2021.
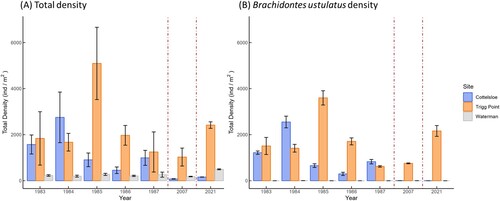
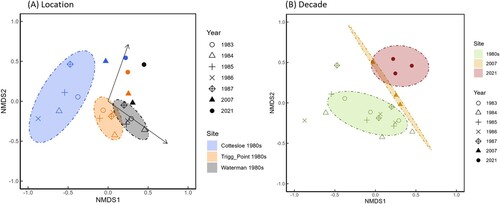
Figure 4. NMDS plot of three sites for seven surveys conducted between 1983 and 2021. Ellipses represent 95% confidence intervals.
Supplementary Tables 2 to 4.docx
Download MS Word (25 KB)Supplementary Figure 1.docx
Download MS Word (91.9 KB)Supplementary Table 1.xlsx
Download MS Excel (29.9 KB)Data availability statement
The data that support this study are included in the supplementary information.