
Figures & data
Table 1. Priorities and principles from the Canterbury Water Management Strategy (Canterbury Mayoral Forum 2009).
Figure 1. Map of the case study area.
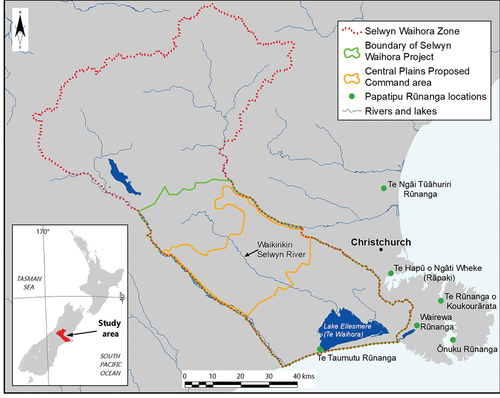
Figure 2. A schematic of the Selwyn Waihora process.
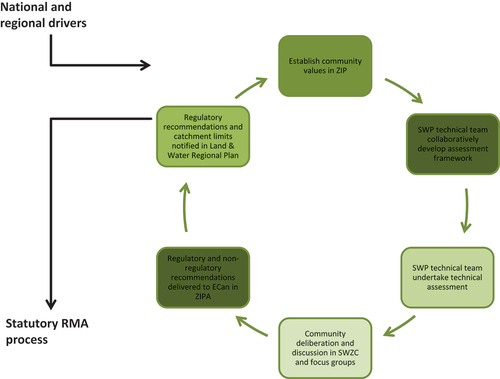
Table 2. Framework of causal mechanisms for the environmental performance of participatory and collaborative governance (source: Newig et al. Citation2018).
Figure 3. Number of technical team engagements (e.g. workshops, public meetings) between the SWP technical team, partners, and stakeholders for different project stages. (Reproduced from Robson-Williams, Small, and Robson-Williams Citation2020a).
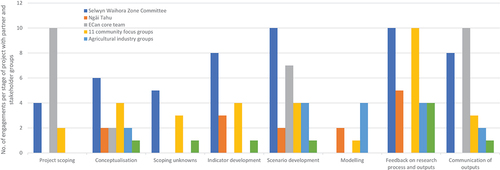
Table 3. Record of formal engagements on policy development in the SWP.
Table 4. Agricultural nitrate-N loads from Selwyn Waihora ZIPA.
Table 5. Overseer modelled N and P losses from farms in Canterbury 2010–2020.