Figures & data
Figure 1. (a) Fire extent and frequency since 2000 in the Basin, and (b) enlarged version focussed on upland forests.
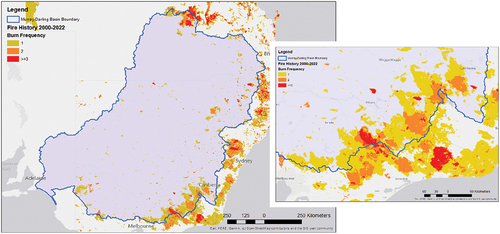
Figure 2. The Kuczera curve (Kuczera Citation1987).
Figure 3. ET trajectories following fire in mixed species eucalypt forests (after Nolan et al. Citation2015).
Figure 4. Modelled effect on streamflow of an additional 4000 ha of plantations (an increase from 16,000 to 20,000 ha) in the Adjungbilly catchment in southern NSW, with streamflow reductions varying from 2,000 ML year−1 (lower dashed line) to 8,000 ML year−1 (upper dashed line) depending on location within the catchment. Also shown is the effect of planting the entire catchment, starting either with the lowest impact areas first (blue line) or the highest impact areas first (red line). (Figure ES 2 from Gilfedder et al. Citation2010).
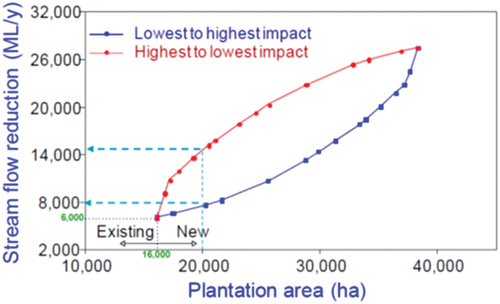
Figure 5. Observed relationship between percent plantation cover and relative streamflow reduction among 15 small and large (0.6 to 1136 km2) catchments in southern Australia, (from Zhang et al. Citation2011).
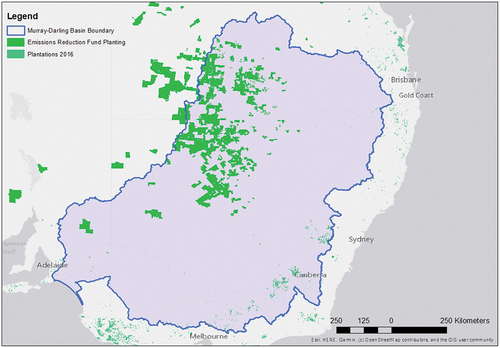
Figure 6. Plantation and carbon plantings and vegetation protection in the Basin. Note that the planting and protected area under the emissions reduction fund are approximate and the shading denote property boundaries rather than the actual area of planting. The plantation areas are from 2016 data (https://www.awe.gov.au/abares/forestsaustralia/forest-data-maps-and-tools/spatial-data/australias-plantations).