
Figures & data
Figure 1. Map of the Murray–Darling Basin, showing irrigation areas, major rivers, wetlands and regional centres.
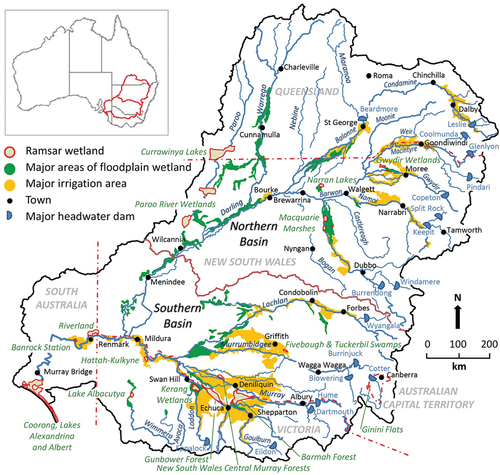
Figure 2. The approximate water budget of the Murray–Darling Basin (mm y−1) under a scenario of current water resource development and historical climate. Potential losses and uncertainties due to risks to shared water resources are in red. Based on Leblanc et al. (2011, Figure 2 therein).
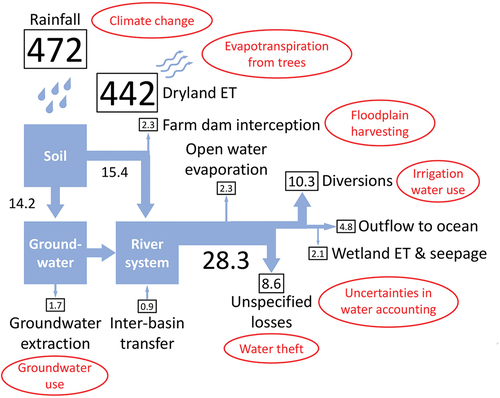
Table 1. The state of risks to shared water resources in the Murray–Darling Basin since 2006. ↑ = increased risk; ↓ = decreased risk; and new = where an existing risk has been compounded by a new risk. For example, increase in the volume of take from floodplain harvesting in the New South Wales northern Basin, which poses a substantial risk to inflows to the Barwon–Darling River and its tributaries, has been possible because of an increase in the construction of farm dams.
Figure 3. Causal loop diagram showing major interactions of risks to shared water resources in the Murray–Darling Basin and their effects. Risks are in red, effects in black.
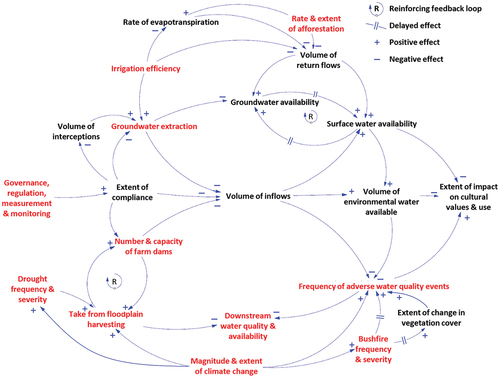
Table 2. Risk interactions relating to shared water resources of the MurrayDarling Basin. Magnitude and extent of interaction: red = high; amber = medium; blue = low. x indicates interaction exists but evidence of magnitude and extent is limited.