
Figures & data
Table 1. Summary of SILO-related functions in SWTools package.
Figure 1. Map of the catchment contributing to station A5050517 and rainfall stations within and near the catchment. Rainfall site 23705 is 20 km to the south, at a similar elevation and annual rainfall to site 23313.
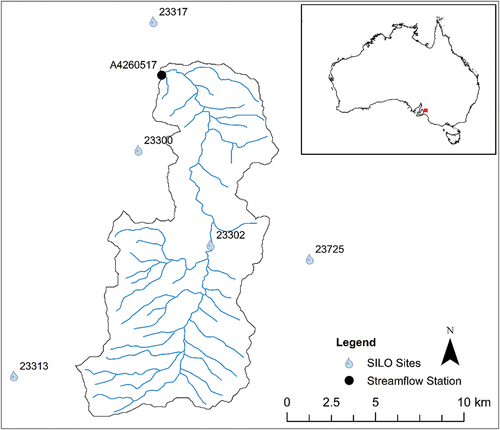
Figure 2. Rainfall data quality codes for the stations available for the case study catchment, produced by SILOQualityCodes(). Interpolated daily observations (orange) indicates where spatial interpolation has been used to infill the data record, or to extend the data record in the case of closed stations.
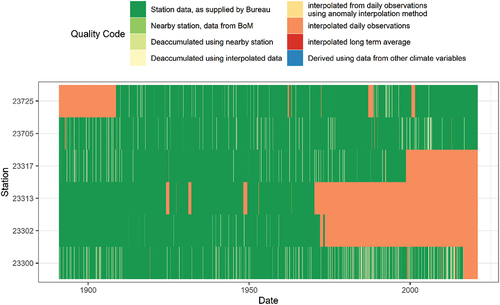
Figure 3. Homogeneity tests from SILOCheckConsistency() for station 23313. The outputs suggest the interpolated data (orange points in double mass curve panel) are significantly different to the observed data (green) with a reduction in slope of 13.5% and significant p value (p<<0.05). The residuals of annual rainfall to straight line panel also supports this discontinuity, with the cumulative residuals over 1000 mm outside the 95th percentile ellipse, with the peak also coinciding with the closing of the site in 1970.
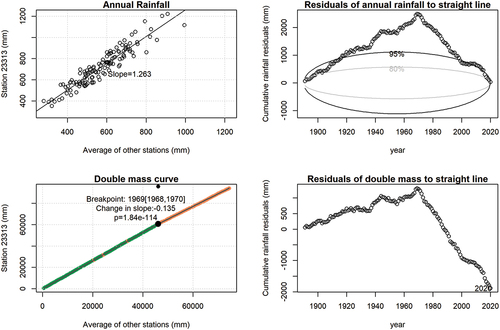
Figure 4. Homogeneity tests from SILOCheckConisistency() for station 23705. For this site, the breakpoint analysis did not identify a statistically significant change in slope. The residuals of annual rainfall to straight line panel deviate beyond the 80th percentile confidence level for only a small number of years. Based on these results, this site was deemed to have homogeneous data throughout the record.
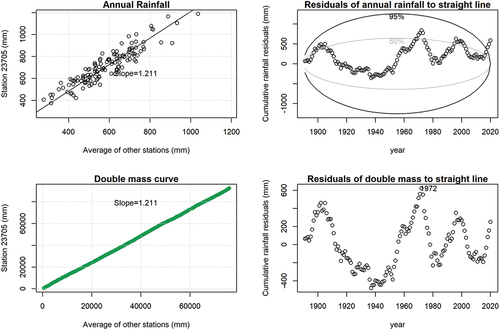
Figure 5. Annual rainfall totals for two rainfall stations near the study catchment. The linear regression lines were used to correct rainfall data for station 23313 (produced by SILOCorrectSite()). The trend line for the second period (blue) is scaled up to match the relationship between stations for the period with homogeneous data (red line) to correct for the non-homogeneity identified in .
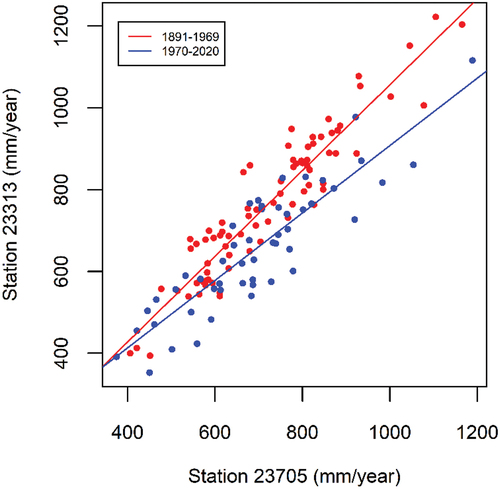
Figure 6. Homogeneity tests from SILOCheckConisistency function for station 23313 after applying SILOCorrectSite function for station 23313 based on station 23705 for the interpolated data after 1970. In contrast to , now the interpolated data are consistent with the observed data prior to 1970, as indicated by the constant slope in the double mass curve panel, and cumulative residuals within the 80th percentile ellipse (top right).
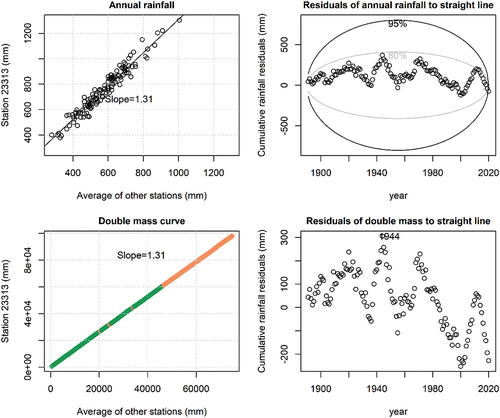
Table 2. Results from the rainfall runoff model for streamflow station A5050517, including Kling–Gupta Efficiency (KGE), Nash–Sutcliffe Efficiency (NSE) values for the calibration and validation periods, based on both the original SILO rainfall data (‘Original’), and the rainfall data corrected for non-homogeneity (‘Corrected’). The mean annual rainfall (P) and simulated streamflow (Q) for both rainfall datasets and each period are also provided.
Table 3. Calibrated GR6J model parameters based on both the original SILO rainfall data (‘Original’), and the rainfall data corrected for non-homogeneity (‘Corrected’).
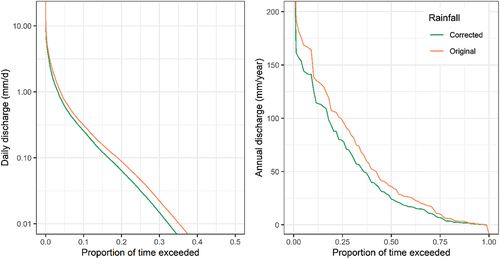
Figure 7. Exceedance curve of daily (left) and annual discharge (right) over the period prior to model calibration (1891–1977) for the rainfall runoff models calibrated to the original and corrected rainfall data.
Data availability statement
The SWTools package is available from the Comprehensive R Archive Network. The Source code and code to produce the analyses in this manuscript are available at https://github.com/matt-s-gibbs/swtools and https://github.com/matt-s-gibbs/Rainfall-homogeneity-example., respectively.