Figures & data
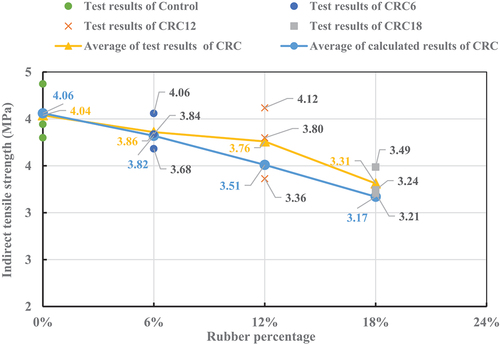
Figure 1. Comparison of indirect tensile strength of CRC.
Table 1. Mix proportions.
Figure 2. Indirect tensile test setup.
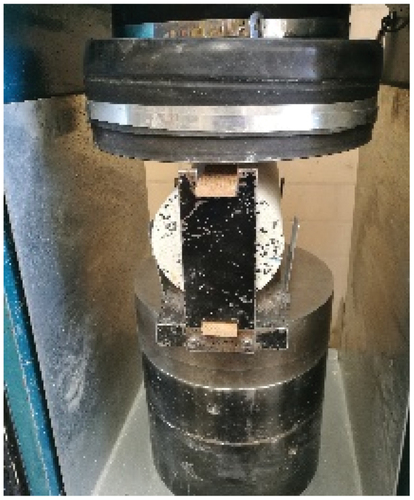
Figure 3. Five-phase structure of CRC.
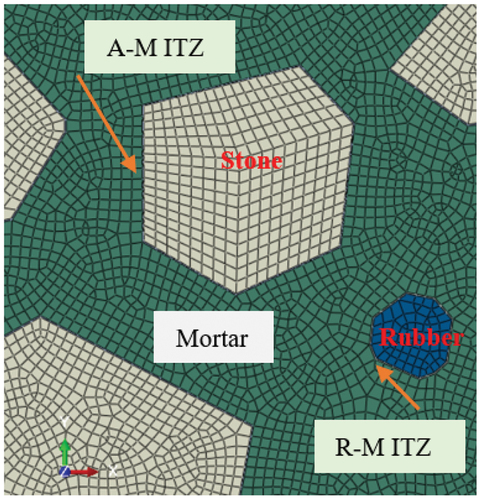
Figure 4. Mesoscale model of CRC18 for indirect tensile test.
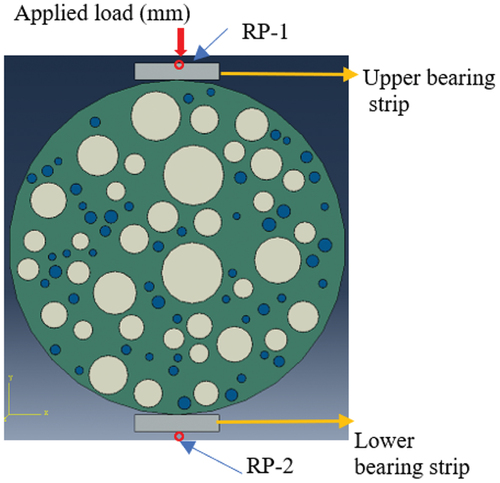
Table 2. Material properties.
Table 3. The content of rubber particles in 3D and 2D CRC samples.
Figure 5. CRC18 with an element size of 0.2mm.
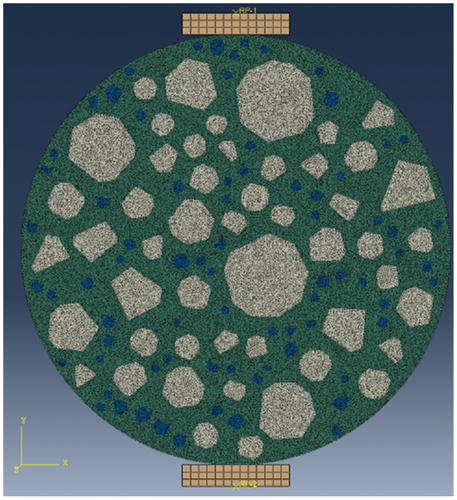
Figure 6. CRC18 with an element size of 2mm.
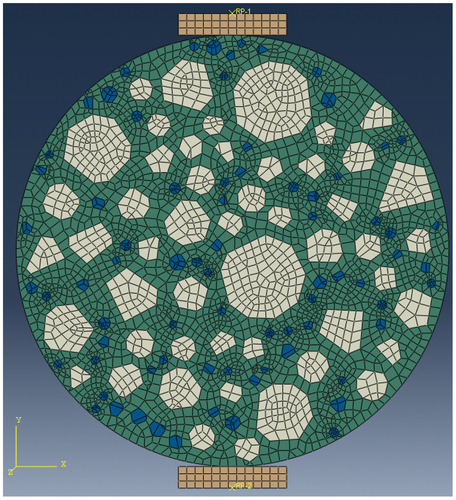
Table 4. Effect of element size on the tensile strength of CRC.
Figure 7. Effect of rubber particle shapes on tensile strength of CRC.
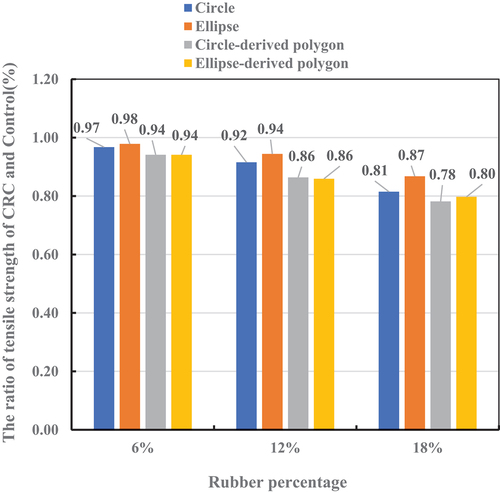
Figure 8. The effect of R-M ITZ on the tensile strength of CRC.
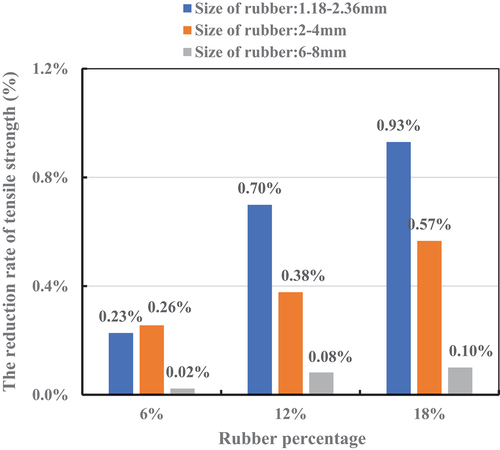
Figure 9. The area ratio of A-M ITZ to rubber particles in CRC.
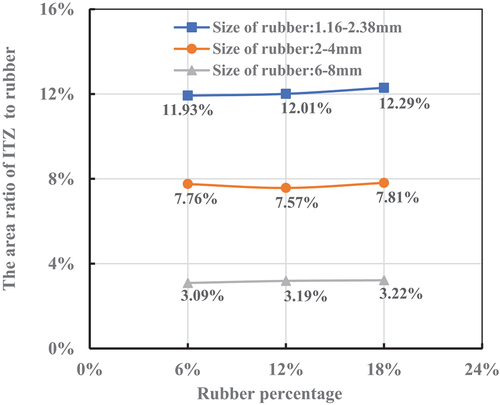
Figure 10. CRC 18 specimens with four different types of stone and rubber particle distribution.
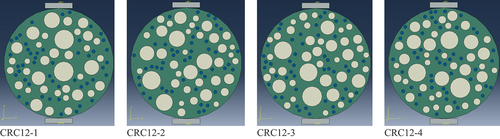
Table 5. The tensile strength of CRC 6 and CRC18 with different aggregate distributions.
Figure 11. The effect of mortar matrix strength on the tensile strength of CRC.
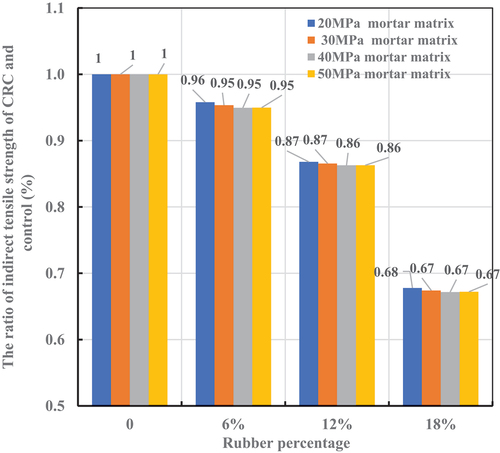
Figure 12. The change in the tensile strength of CRC after treating rubber as pores.
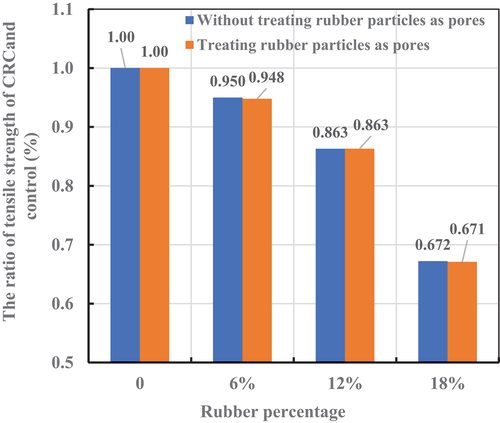
Figure 13. Compressive damage mode of CRC model and reference model with pores.
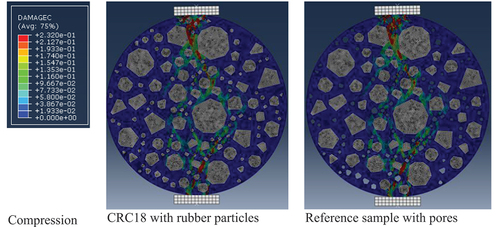
Figure 14. Tensile damage mode of CRM model and reference model with pores.
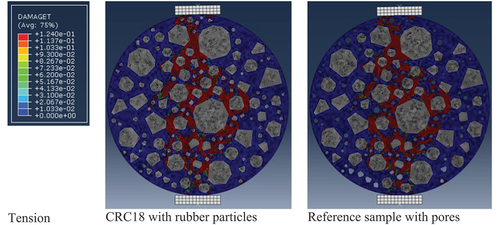
Table 6. The tensile strength of CRC obtained by numerical simulation.
Figure 15. The fitting curve of tensile strength and rubber content.
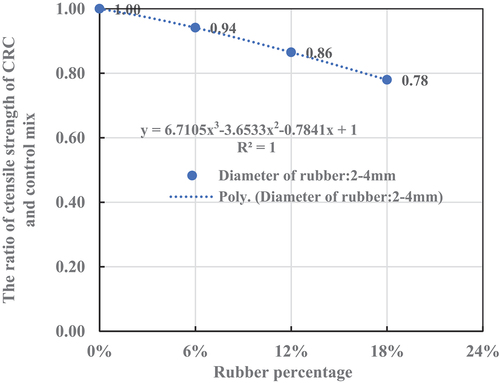
Figure 16. Failure mode of CRM18 specimen.
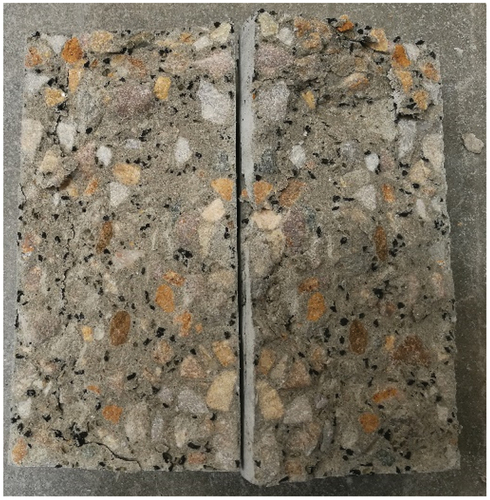
Table 7. Test results of indirect tensile strength.
Figure 17. Comparison of experimental and simulated values.