Figures & data
Figure 1. Schematic of fitments in masonry.
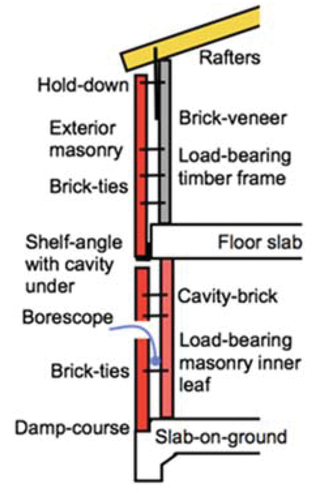
Figure 2. Loss of wall-tie connection, corrosion and mortar degradation.
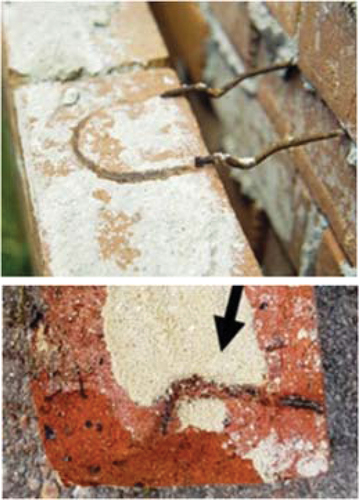
Figure 3. Collapse of parapet, 1930s Matilda Bay Brewing complex in 2017 (Mayes Citation2017).
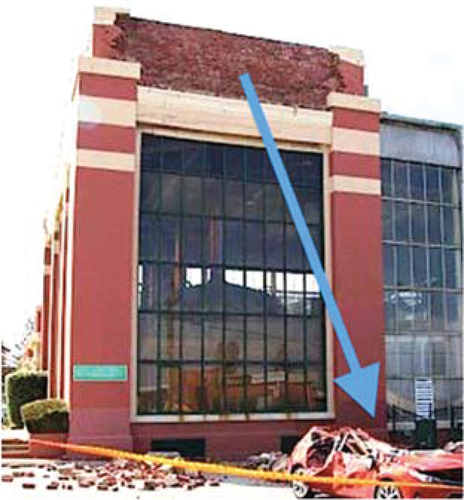
Figure 4. Instrumented house modules for detailed wall-tie corrosion assessment, with access door located on west elevation (top) and plan view with cardinal orientation (bottom)(Terry et al. Citation2023).
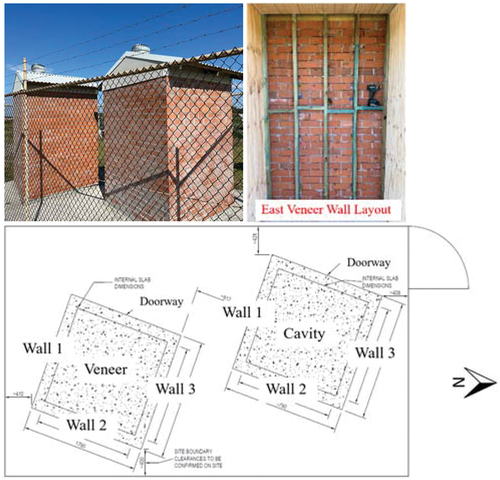
Figure 5. Example layout plan of commercially available brick veneer wall ties. MS denotes plain steel ties, SS denotes stainless steel ties, and Z600 and Z950 represent light and heavy galvanised, respectively (Terry et al. Citation2023).
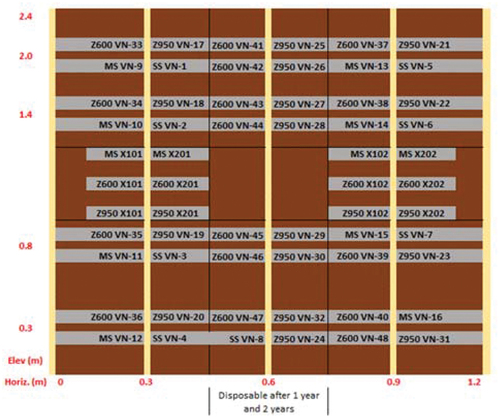
Figure 6. Brick veneer wall system in the University of Newcastle Civil Eng. laboratory for non-destructive assessment (scale 1:1). Input modal impact hammer shown on right, with removable wall ties shown in the middle, and adjustable output accelerometers shown on left.
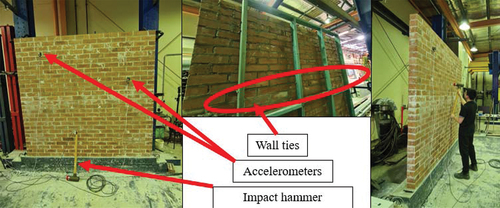
Figure 7. Example 68-year-old wall east elevation inspected showing ventilation bricks and cavity access point (left), wall cavity ties showing brown steel corrosion staining as evidence of loss of protective galvanised layer (middle), and example of remaining thickness measurement (4.3mm), suggesting a likely original thickness of 5 mm (Ancon Citation2021) (right).
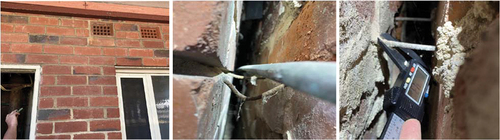
Figure 8. Example logged cavity temperature data (°C) for the brick veneer house module comparing differences by elevation (left) and internal vs external conditions (right).
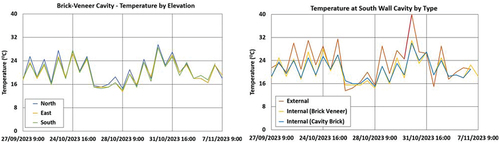
Figure 9. Example cavity logged relative humidity (%RH) data for brick veneer house module, comparing differences by elevation (left) and internal vs external conditions (right).
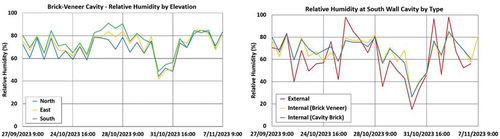
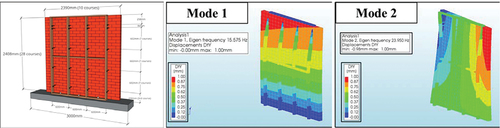
Figure 10. Example brick veneer wall panel numerically simulated (left) structural vibration behaviour and predicted modal parameters (Bending and Torsional) and associated natural frequencies (16 Hz mode 1 and 24 Hz mode 2). The colours represent the extent and direction of movement (Scale bar in millimetres) (Lam, Masia, and Chaves Citation2023).