Figures & data
Table 1. Development indicators of the Montenegrin stock market.
Figure 1. Fluctuation in prices of the Budva Riviera Company stocks from 2007 to 2011.
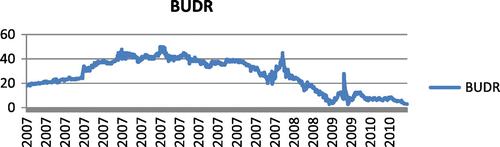
Table 2. Initial data-set-metadata view.
Table 3. Generalisation of attributes.
Table 4. Results of the linear regression.
Figure 2. Model of logistic regression.
Note: Since that the class H is positive one, the factors with positive coefficients have an influence on the high preferences of investors, while the low preferences influence factors with negative coefficients. Coefficients with larger absolute value have a stronger impact in both cases. Thus, for example, from this model can be concluded that low total market capitalisation has the most influence on the low preferences of investors (factor Size-Low has a negative coefficient with the largest absolute value).
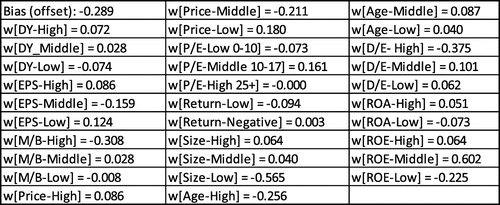
Table 5. Stock preferences of investors with different features.
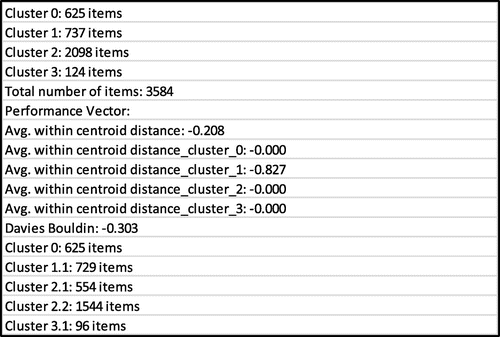
Figure A1. Cluster model and performance.
Note: Avg. within centroid distance is the average within cluster distance is calculated by averaging the distance between the centroid and all examples of a cluster (smaller value is preferred). The algorithms that produce clusters with low intra-cluster distances and high inter-cluster distances will have a low Davies–Bouldin index. The clustering algorithm that produces a collection of clusters with the smallest Davies–Bouldin index is considered the best algorithm based on this criterion.