Figures & data
Table 1. The composition of personal consumption in Croatia, in selected years (in %).
Figure 1. Seasonally adjusted indices of retail turnover in Croatia (2010 = 100).
Source: Eurostat (Citation2013), authors’ calculations.
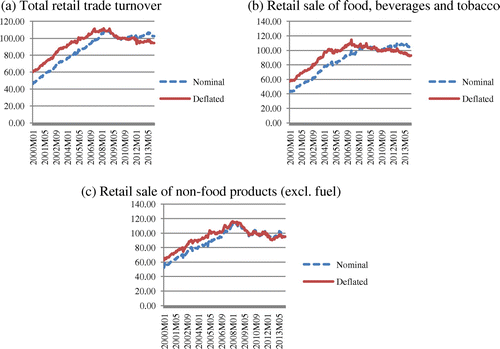
Figure 2. The impact of the recession on total retail turnover in the European Union (the spread between the post-2008 minimum level of turnover and the pre-2008 maximum level of turnover, in index points).
Source: Eurostat, authors’ calculations.
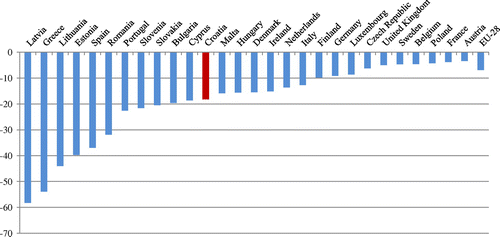
Figure 3. Post-recession recovery of the total retail turnover index in the European Union (the spread between the 2014:M01 turnover and the minimum level of turnover during 2008–2010, in index points).
Source: Eurostat, authors’ calculations.
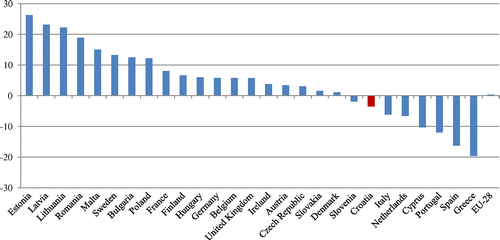
Figure 4. The correlation between the 2012 level of private debt (in % of GDP, x-axis) and the post-recession recovery of the total retail turnover index in the European Union (y-axis).
Source: Eurostat, authors’ calculations.
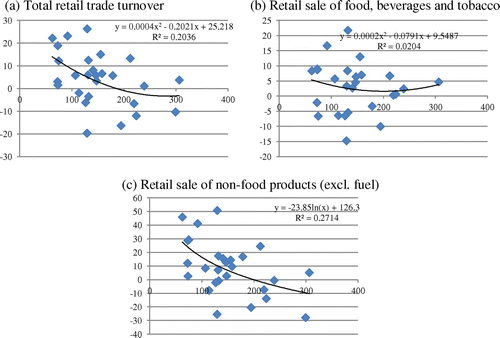
Table 2. Description of variables included in the model.
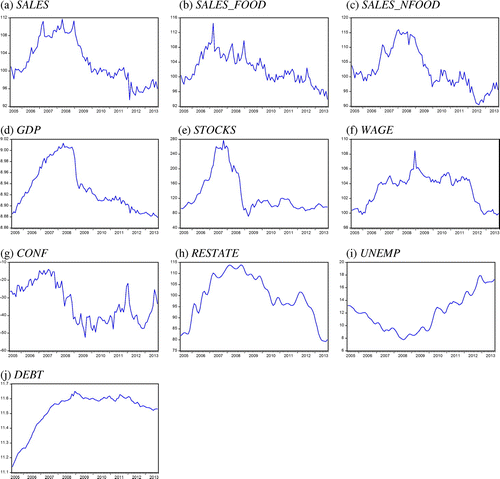
Figure 5. Variables included in the model.
Source: IFS, Eurostat, HNB, Burza nekretnina d.o.o., authors’ calculations.