1,680
Views
3
CrossRef citations to date
0
Altmetric
Articles

To what extent does Croatia really cooperate with SEE countries in the fields of foreign trade, direct investment and tourism?

, &
Pages 879-906 | Received 09 Apr 2014, Accepted 11 Jun 2015, Published online: 27 Oct 2015

Figures & data

Table 1. Countries in the region – main trends in foreign trade.

Figure 1. Croatian exports to countries in the region and the EU 27, 2001–2012.
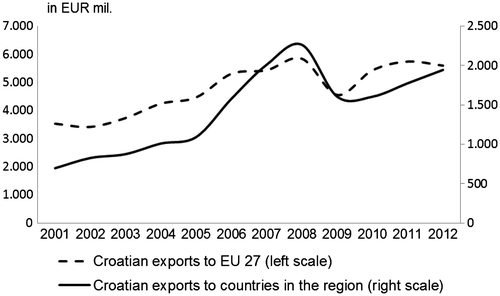
Source: Eurostat COMEXT database.
Figure 1. Croatian exports to countries in the region and the EU 27, 2001–2012.

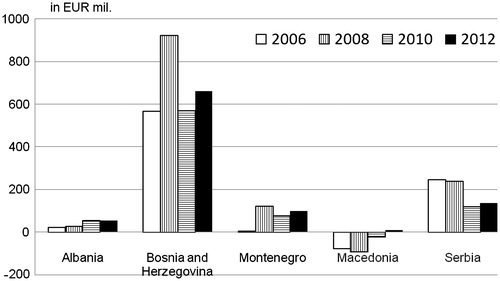
Figure 2. Croatia’s trade balance with countries in the region.

Source: Eurostat COMEXT database.
Figure 2. Croatia’s trade balance with countries in the region.

Table 2. LFI Index, GL index and the share of individual economic sectors in total Croatian exports (% EX) in 2012.

Table 3. ES Indicator.

Figure 3. FDI inward stock per capita and total FDI inward stock, in 2011.
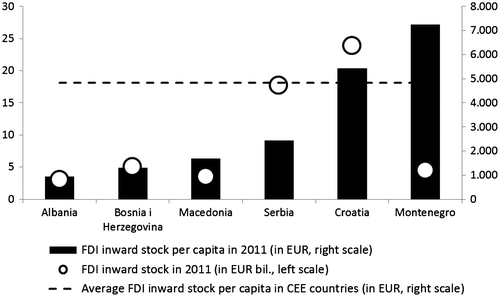
Source: WIIW (Citation2012).
Figure 3. FDI inward stock per capita and total FDI inward stock, in 2011.

Figure 4. Croatian direct investment stock in the region in 2012, in %.
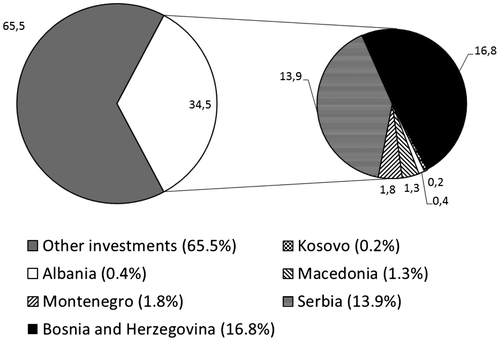
Source: Croatian National Bank.
Figure 4. Croatian direct investment stock in the region in 2012, in %.

Figure 5. Tourist arrivals by country and/or region, and arrivals per capita, in 2012.
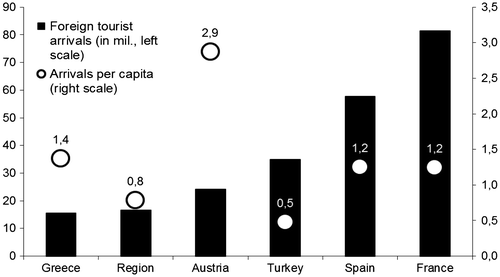
Source: National Statistical Offices, World Bank, World Tourism Barometer 2012.
Figure 5. Tourist arrivals by country and/or region, and arrivals per capita, in 2012.

Figure 6. Tourist arrivals and overnight stays in Croatia from the region, 1999–2012.
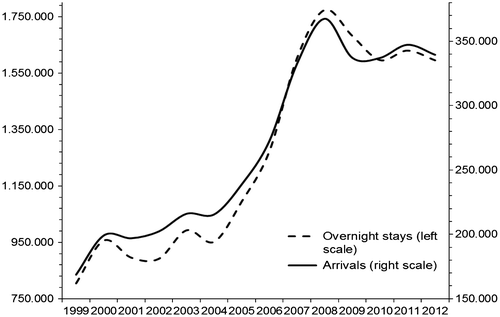
Source: Croatian Bureau of Statistics.
Figure 6. Tourist arrivals and overnight stays in Croatia from the region, 1999–2012.

Figure 7. Comparison of cooperation indices with countries in the region, EU 27 and the world.
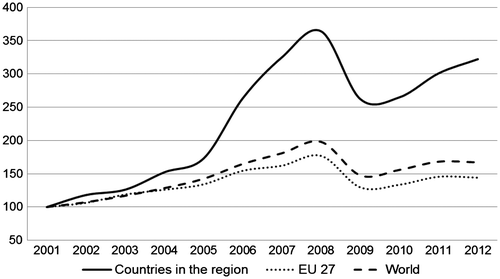
Source: Authors’ calculations.
Figure 7. Comparison of cooperation indices with countries in the region, EU 27 and the world.

Figure 8. Foreign trade cooperation index between Croatia and countries in the region, with contributions of individual countries to the index.
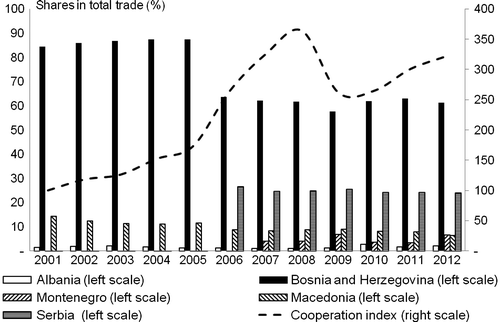
Source: Authors’ calculations.
Figure 8. Foreign trade cooperation index between Croatia and countries in the region, with contributions of individual countries to the index.

Figure 9. Index of regional cooperation based on foreign direct investment flows from the region into Croatia and Croatia’s direct investment in the region, 2000–2012.
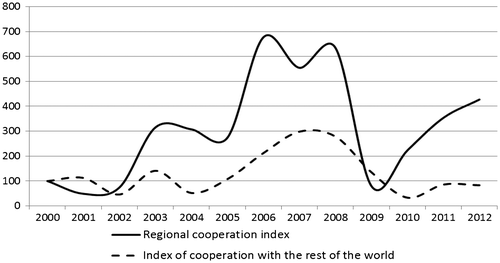
Source: Authors’ calculations.
Figure 9. Index of regional cooperation based on foreign direct investment flows from the region into Croatia and Croatia’s direct investment in the region, 2000–2012.

Figure 10. Index of regional foreign direct investment cooperation based on FDI stock, with shares of individual countries in the index, 2000–2012.
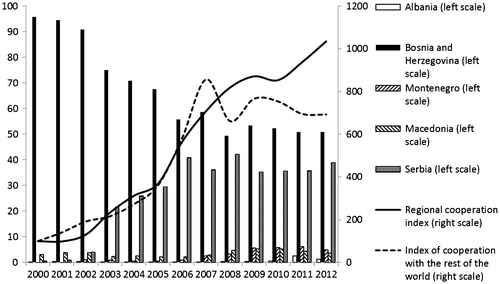
Source: Authors’ calculations.
Figure 10. Index of regional foreign direct investment cooperation based on FDI stock, with shares of individual countries in the index, 2000–2012.

Figure 11. Index of tourism cooperation based on the number of overnight stays of tourists from the region, with shares of individual countries in the index, 2000–2012.
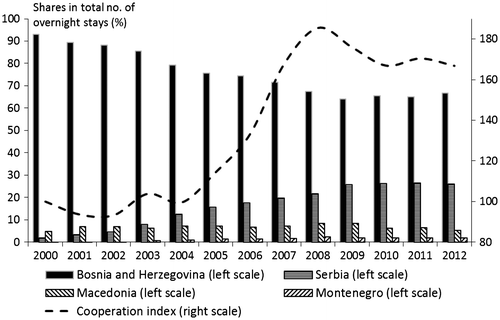
Source: Authors’ calculations.
Figure 11. Index of tourism cooperation based on the number of overnight stays of tourists from the region, with shares of individual countries in the index, 2000–2012.

Figure 12. Index of tourism cooperation based on earnings from tourists from the region, 2000–2012.
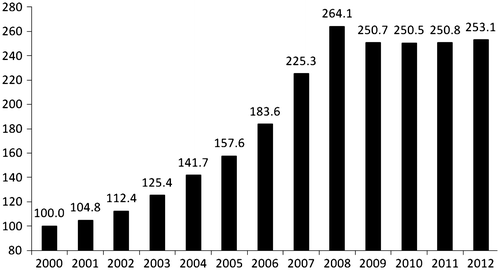
Source: Authors’ calculations.
Figure 12. Index of tourism cooperation based on earnings from tourists from the region, 2000–2012.

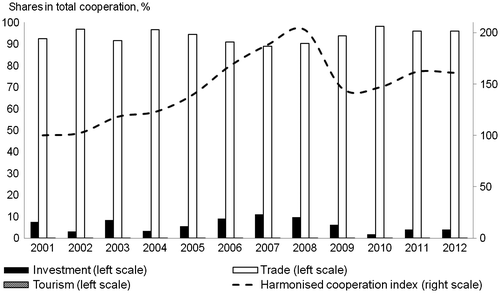
Figure 13. Harmonised cooperation index between Croatia and countries in the region, with contributions of individual economic sectors to the index.
Source: Authors’ calculations.
Figure 13. Harmonised cooperation index between Croatia and countries in the region, with contributions of individual economic sectors to the index.

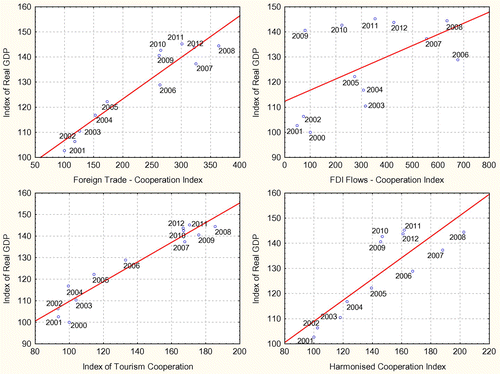
Figure 14. The relationship between cooperation indices and real GDP, 2000=100.
Source: Authors’ calculations.
Figure 14. The relationship between cooperation indices and real GDP, 2000=100.