Figures & data
Table 1. Characteristics of informants’ firms.
Figure 1. Online methods usage. Source: Authors.
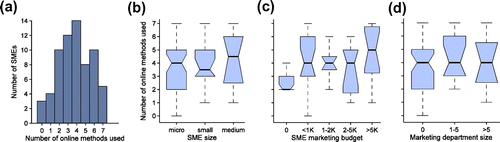
Figure 2. Social media usage. Source: Authors.
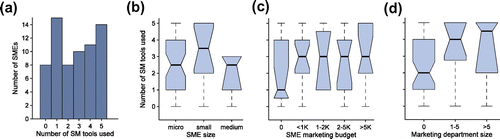
Table 2. Descriptive statistics and correlations of influential factors for buying decisions (n = 66).
Table 3. Descriptive statistics and correlation matrix (n = 66).
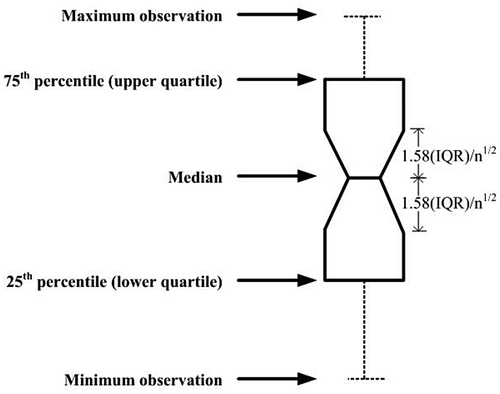
Figure 1A. Annotated notched box plot. Source: SAS Institute Inc, Citation1999, p. 1766.