5,124
Views
2
CrossRef citations to date
0
Altmetric
Articles

Employees’ individual values as a source of human capital

, &
Pages 1057-1072 | Received 25 May 2015, Accepted 04 Mar 2016, Published online: 12 May 2017

Figures & data

Table 1. Share of respondents by region/country by gender (n;%).

Table 2. The significance of differences between subsamples of respondents in relation to their answers on individual values.

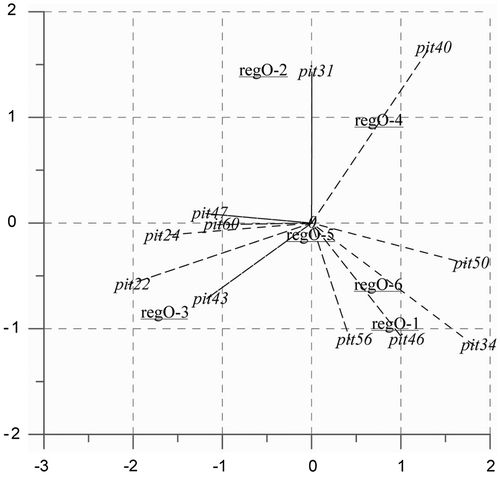
Figure 1. Characteristics of subsamples – companies. Source: Authors’ processing.

Figure 1. Characteristics of subsamples – companies. Source: Authors’ processing.

Table 3. Mahalanobis distance between subsamples of respondents.

Table 4. Grouping of subsamples from the country/region.

Figure 2. Dendrogram – Grouping of value profiles (companies). Croatia (1); Italy; (2) Hungary (3); Romania (4); southern Serbia (5); northern Serbia (6). Source: Authors’ processing.
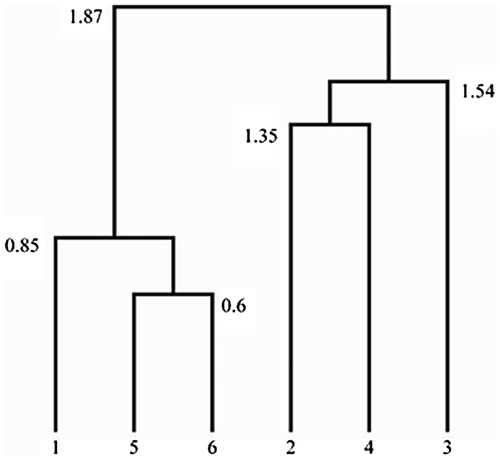
Figure 2. Dendrogram – Grouping of value profiles (companies). Croatia (1); Italy; (2) Hungary (3); Romania (4); southern Serbia (5); northern Serbia (6). Source: Authors’ processing.

Table 5. The significance of differences between subsamples of respondents in relation to their answers on individual values.

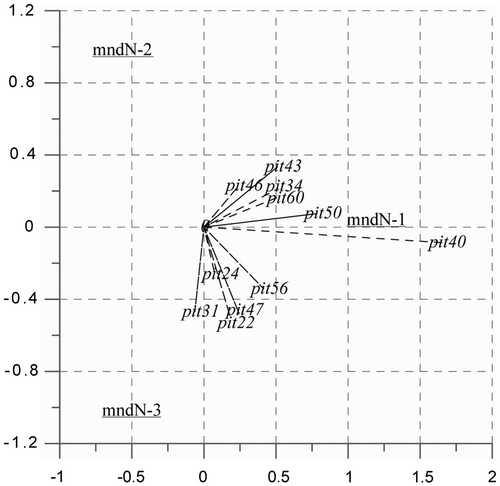
Figure 3. Characteristics of subsamples – local government units. Source: Authors’ processing.

Figure 3. Characteristics of subsamples – local government units. Source: Authors’ processing.

Table 6. Mahalanobis distance between subsamples of respondents.

Table 7. Grouping of subsamples from the country/region.

Figure 4. Dendrogram – Grouping of value profiles (local government units). Croatia (1); Hungary (2); Romania (3); Slovenia (4); southern Serbia (5); northern Serbia (6). Source: Authors’ processing.
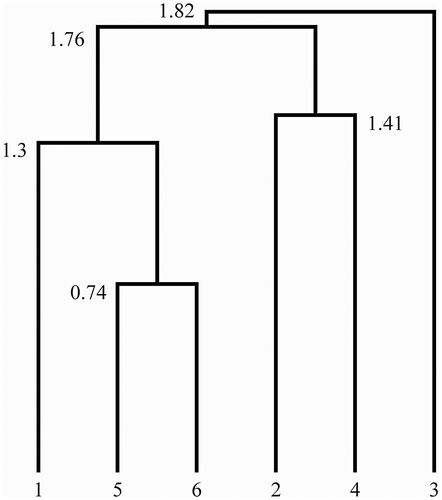
Figure 4. Dendrogram – Grouping of value profiles (local government units). Croatia (1); Hungary (2); Romania (3); Slovenia (4); southern Serbia (5); northern Serbia (6). Source: Authors’ processing.
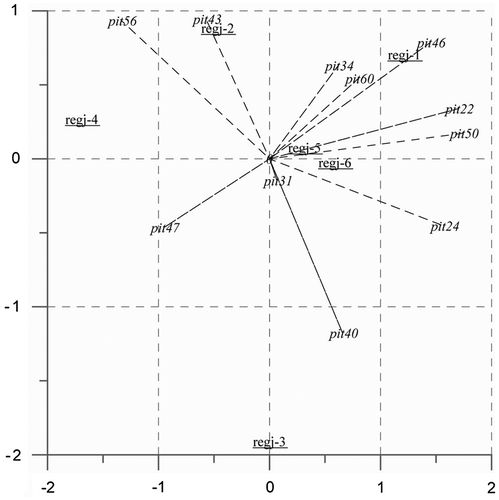
Table 8. The significance of differences between subsamples of respondents in relation to their answers on individual values.

Figure 5. Characteristics of subsamples – positions in management. Source: Authors’ processing.

Figure 5. Characteristics of subsamples – positions in management. Source: Authors’ processing.

Table 9. Mahalanobis distance between subsamples of respondents.

Table 10. Grouping of subsamples’ positions in relation to their responses.

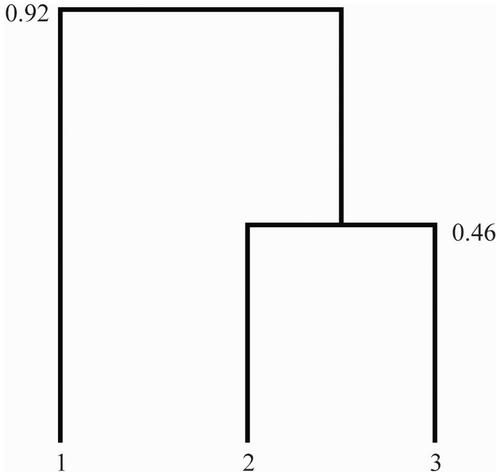
Figure 6. Dendrogram – Grouping of value profiles (positions in management). Top management (1); middle management (2); lower management (3). Source: Authors’ processing.

Figure 6. Dendrogram – Grouping of value profiles (positions in management). Top management (1); middle management (2); lower management (3). Source: Authors’ processing.