Figures & data
Figure 1. Schematic to illustrate the steps in calculating the UN HDI. Source: Adapted from UNDP (2014).
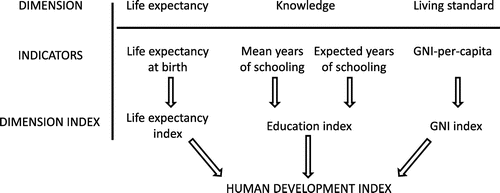
Table 1. Summarising the data used for this study, including basic data statistics and sources. See text for further details.
Figure 2. Correlations between the GDP and (a) the HDI, n = 2054; (b) life expectancy, n = 2287; (c) expected years of schooling, n = 2099; (d) mean years of schooling, n = 1987; and (e) GNI-per-capita, n = 2171. Source: Authors.
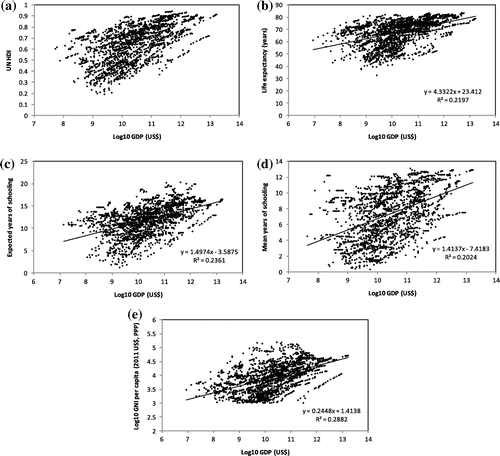
Figure 3. Correlations between the GDP-per-capita and (a) the HDI, n = 1781; (b) life expectancy, n = 2232; (c) expected years of schooling, n = 2151; (d) mean years of schooling, n = 1987; and (e) GNI-per-capita, n = 2083. Source: Authors.
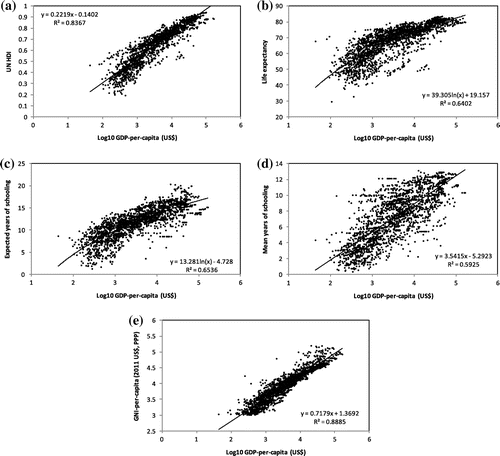
Figure 4. Correlations between access to safe drinking water and (a) the HDI, n = 333; (b) life expectancy, n = 349; (c) expected years of schooling, n = 350; (d) mean years of schooling, n = 334; and (e) GNI-per-capita, n = 337. Source: Authors.
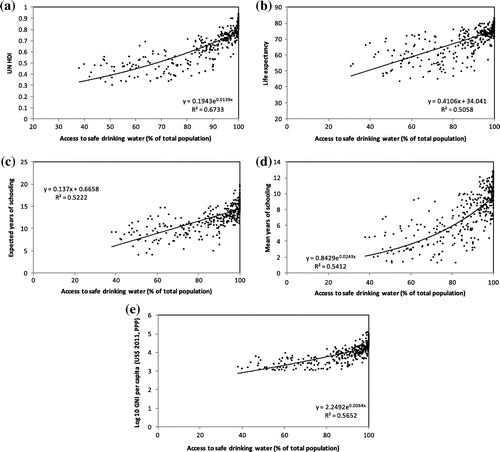
Figure 5. Correlations between access to electricity and (a) the HDI, n = 643; (b) life expectancy, n = 407; (c) expected years of schooling, n = 697; (d) mean years of schooling, n = 647; and (e) GNI-per-capita, n = 682. Source: Authors.
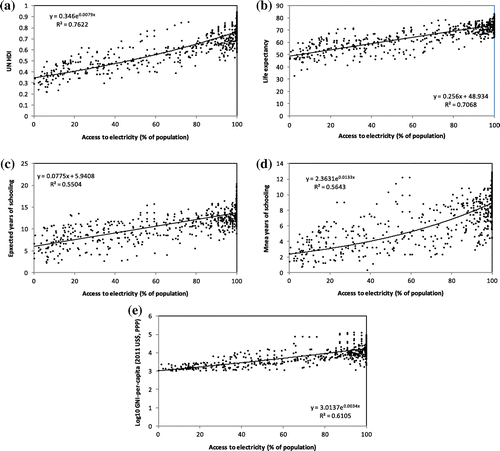
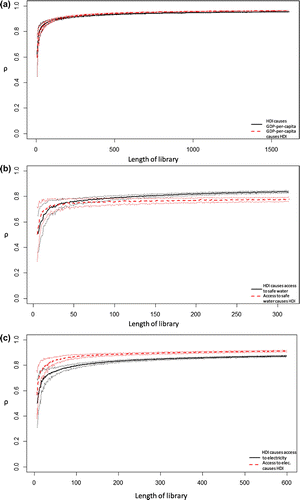
Figure 6. Multi-spatial CCM results to discern causality between: (a) HDI and GDP-per-capita; (b) HDI and access to safe drinking water; and (c) HDI and access to electricity. Solid lines show the mean of the simulations. Dashed lines indicate standard deviation. Stable values of rho significantly >0 imply causation. Source: Authors.