Figures & data
Figure 1. Conditions of stock markets before, during and after the global financial crisis
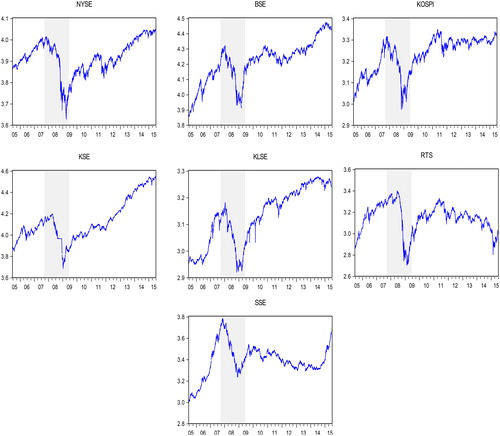
Table 1. Descriptive statistics for stock index return series.
Table 2. Augmented Dickey-Fuller unit root test.
Table 3. Results of the Johansen and Juselius cointegration test.
Table 4. G.A.R.C.H.-B.E.K.K. results for the pre-crisis period.
Table 5. G.A.R.C.H.-B.E.K.K. results for the crisis period.
Table 6. G.A.R.C.H.-B.E.K.K. results for the post-crisis period.
Table A1. Pre-crisis vector error correction model (V.E.C.M.)
Table A2. During crisis vector error correction model (V.E.C.M.)
Table A3. Post-crisis vector error correction model (V.E.C.M.)
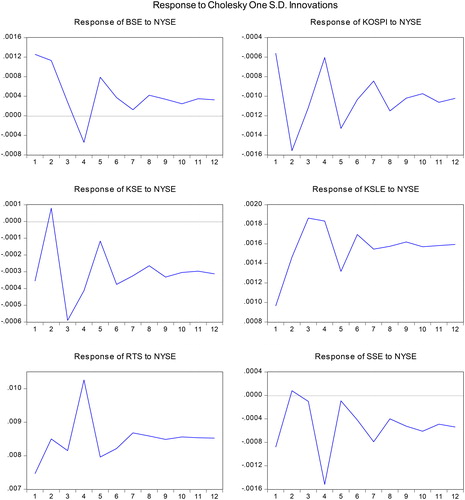
Figure B1. Impulse response Pre-Crisis Period (01/07/2005-30/07/2007)
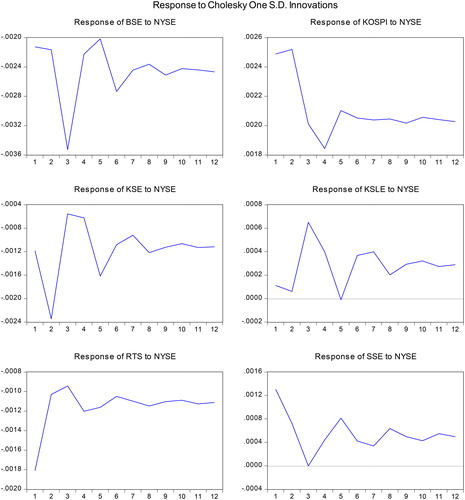
Figure B2. Impulse response During-crisis Period (01/08/2007-30/05/2009)
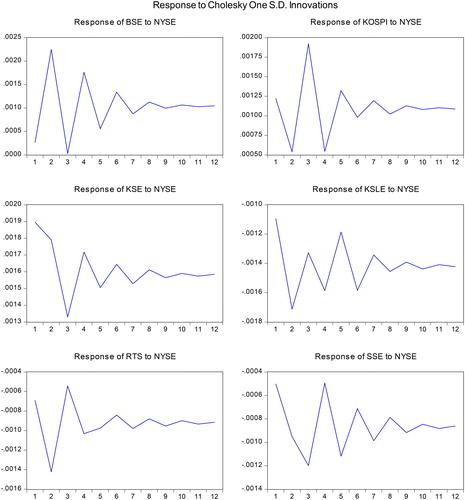
Figure B3. Impulse response Post-Crisis Period (01/06/2009-30/06/2015).