
Figures & data
Figure 1a. Interest rate behaviour in Turkey from 7 January 2011 to 10 June 2015. Source: C.B.R.T.’s interactive graphing tool. Upper limit of the shaded corridor: O/N lending interest rate; Lower part of the shaded area: O/N borrowing interest rate; Purple: One-week repo rate; Blue: B.I.S.T. overnight repo rates (five-day moving average); Red: C.B.R.T. average fund rate (five-day moving average).
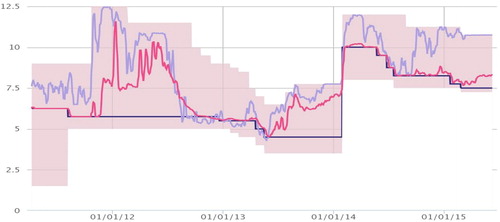
Figure 1b. Ratio of C.B.F. to commercial and retail loans from January 2011 to June 2015 (%). Source: C.B.R.T., E.D.D.S. Note: The y axis is the percentage ratio of C.B.F. to loans.
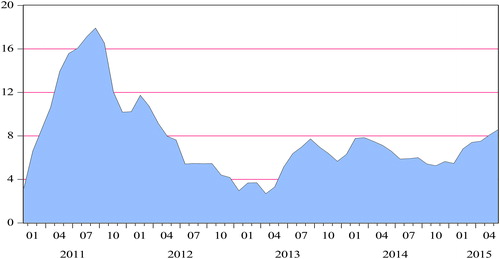
Table 1. Details of the data.
Table 2. Dynamic asymmetric estimation with central bank funding – required reserves.
Figure 2. Central bank funding (C.B.F.) multipliers when required reserves are excluded. Notes: In these figures, the required reserve quantities (R.R.) are reduced from the funding needs data. The solid black line reports the dynamic multiplier for an increase in C.B.F.; the dashed black line is for a decrease in C.B.F.; the middle red line is for the difference in the absolute value of dynamic multipliers; the other two red lines are for the confidence bands for the differences.
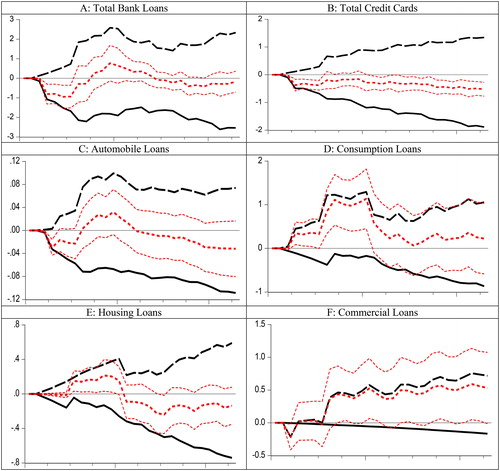
Table 3. Dynamic asymmetric estimation with central bank (gross) funding.