
Figures & data
Figure 1. Evolution of the SCIT rates and percentage of CIT in the GDP in Bulgaria (2002–2015). Source: Author’s own calculations.
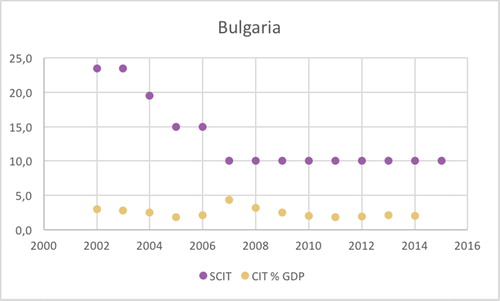
Figure 2. Evolution of the SCIT rates and percentage of CIT in the GDP in Hungary (2002–2015). Source: Author’s own calculations.
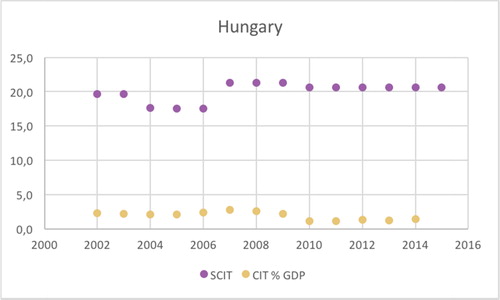
Figure 3. Coefficient confidence intervals GDP model. Source: Author’s own estimations.
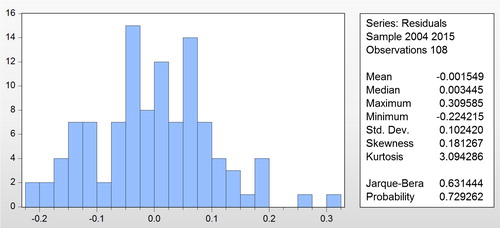
Figure 4. Fitted model for dependent variable GDP. Source: Author’s own estimations.
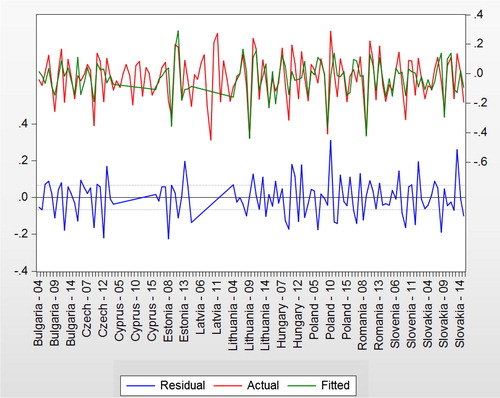
Figure 5. Coefficient confidence intervals FDI model. Source: Author’s own estimations.
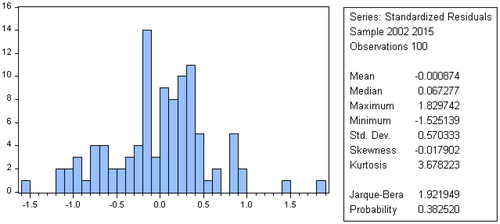
Figure 6. Fitted model for dependent variable FDI. Source: Author’s own estimations.
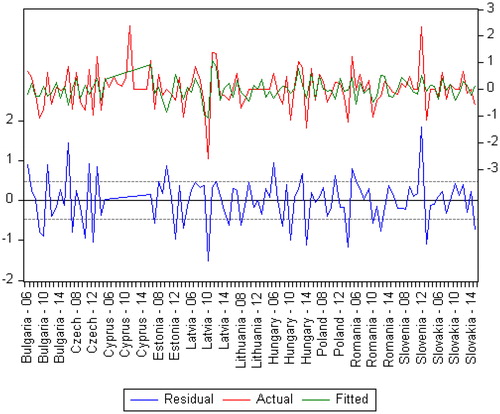
Table 1. Statutory corporate income tax rates in CEE Countries 2002–2014.
Table 2. Results of the panel unit root test.
Table 3 Pedroni residual cointegration.
Table 4. GDP model.
Table 5. FDI model.