
Figures & data
Figure 1. The mutual relationships of the individual factors examined. The curved double-sided arrows indicate correlations, the straight one-sided arrows indicate causal relationships. The unobserved factors are in circles, the observable variables are in the rectangle.
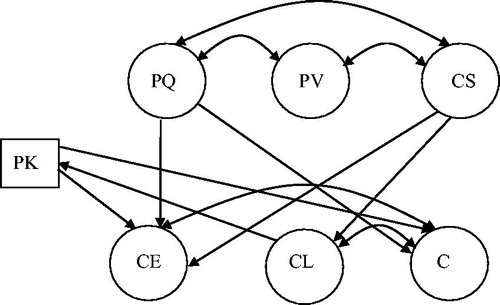
Table 1. Estimations of the model parameters (the factor/variable in italics is explained by the factors shown under them).
Table A1. The questionnaire questions (with the low rating and high rating shown in italics), according to the individual variables and factors.
Table A2. Estimations of model parameters: factor correlation in italics with factors shown below.