
Figures & data
Figure 1. Net migration in CEE Countries, in the period 1996–2017 (the average values of five-year estimates).
Source: World Bank database (http://www.worldbank.org/)
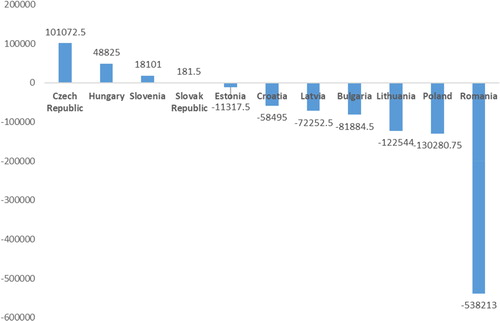
Figure 2. Remittances received in CEE Countries, in the period 1996–2017 (the average values).
Source: World Bank database (http://www.worldbank.org/)
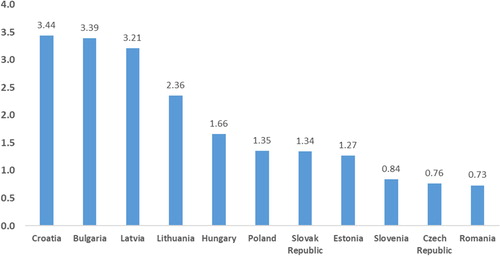
Table 1. Short synthesis of main studies regarding remittances with positive effects (PE) on the economy.
Table 2. Short synthesis of main studies regarding remittances with negative effects (NE) on the economy.
Figure 3. Real GDP per capita in CEE Countries, in the period 1996–2017 (constant millions USD, the average values).
Source: World Bank database (http://www.worldbank.org/)
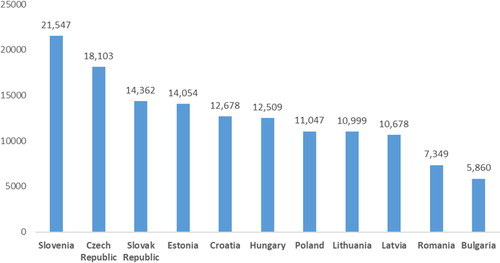
Table 3. Descriptive statistics.
Table 4. The correlations between GDP cycle and Remittances cycle in Central and Eastern European (CEE) Countries (1996–2017).
Figure 4. The procyclical movement of the GDP and Remittances cycles in CEE countries (1996–2017).
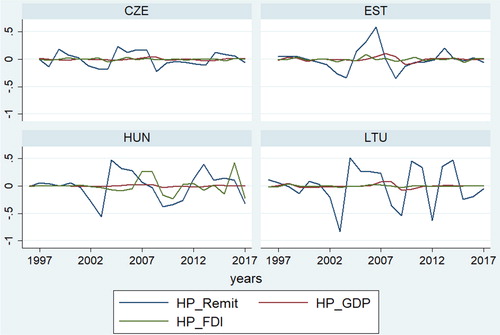
Figure 5. The countercyclical movement of the GDP Remittances and Foreign Direct Investment cycles in CEE countries (1996–2017).
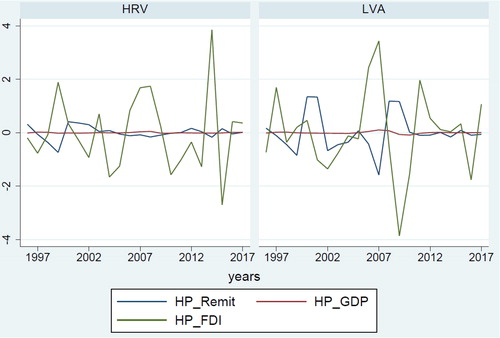
Figure 6. The acyclical movement of the GDP and Remittances cycles in CEE countries (1996–2017).
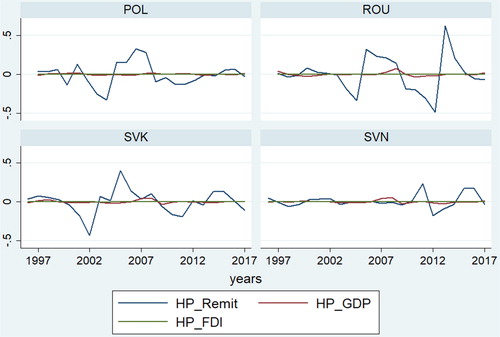
Table 5. The correlation matrix at panel level for CEE countries.
Table 6. The estimates of OLS regression.
Table 7. The estimates of VECM.
Figure 7. The impulse response function for CEE countries.
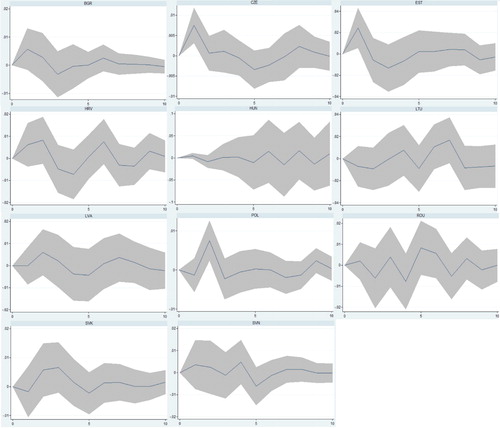
Table 8. Granger causality Wald tests results.