
Figures & data
Table 1. Descriptive statistics of the sample.
Figure 1. Scatter plot between rate of economic growth and average rate of resource consumption – oil, natural gas and coal. Source: own calculations.
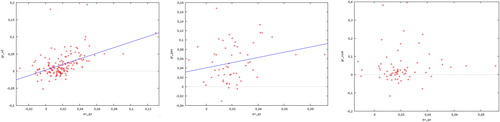
Figure 2. Scatter plot between the rate of economic growth and the average rate of resource consumption – oil, natural gas and coal, O.E.C.D. countries. Source: own calculations.
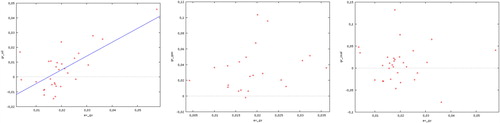
Figure 3. Scatter plot between the rate of economic growth and the average rate of resource consumption – oil, natural gas and coal, non-O.E.C.D. countries. Source: own calculations.
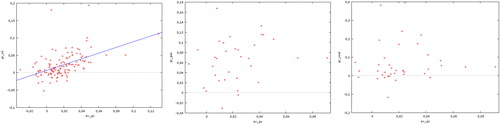
Figure 4. Scatter plot between the rate of growth of physical capital and the average rate of resource consumption – oil, natural gas and coal, all countries. Source: own calculations.
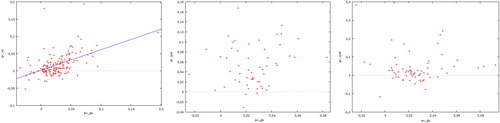
Figure 5. Scatter plot between the rate of growth of physical capital and the average rate of resource consumption – oil, natural gas and coal, O.E.C.D. countries. Source: own calculations.
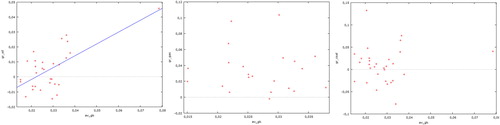
Figure 6. Scatter plot between the rate of growth of physical capital and the average rate of resource consumption – oil, natural gas and coal, non-O.E.C.D. countries. Source: own calculations.
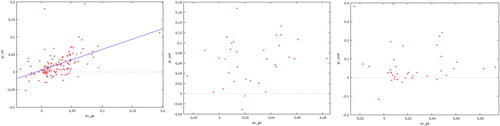
Figure 7. Scatter plot between the rate of economic growth (left) and the rate of growth of physical capital (right) and average rate of growth of DMC, all countries. Source: own calculations.
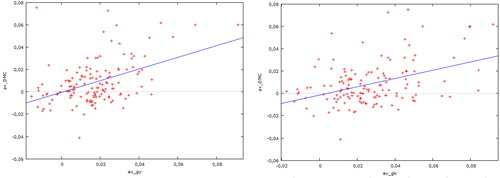
Figure 8. Scatter plot between the rate of economic growth (left) and the rate of growth of physical capital (right) and average rate of growth of DMC, O.E.C.D. countries. Source: own calculations.
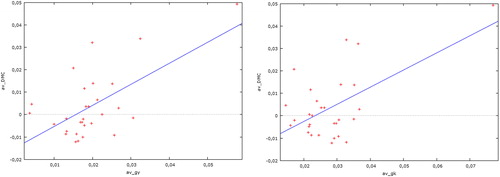
Figure 9. Scatter plot between the rate of economic growth (left) and the rate of growth of physical capital (right) and average rate of growth of DMC, non-O.E.C.D. countries. Source: own calculations.
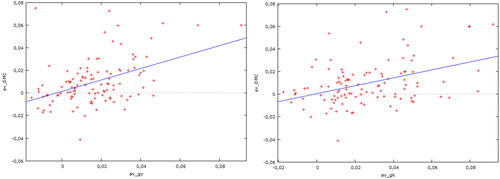
Table 2. The correlation between the average rate of economic growth or the average rate of growth of physical capital, and the average rate of growth of natural resources use.