Figures & data
Table 1. Estimation of the need for resources for investment project implementation.
Table A1. Initial data for modelling in SATTKO.
Table A2. Simulation results in SATTCO.
Table A3. Initial data for modelling the level of localisation of furniture production (for hypothetical furniture products).
Table A4. Results of modelling the level of localisation of furniture production (for conventional furniture products), without optimisation.
Figure 1. Dynamics of added value in the chain (with milk and dairy products as an example) given a decrease in the share of imported components in comparable prices; million roubles. Source: Authors’ calculations.
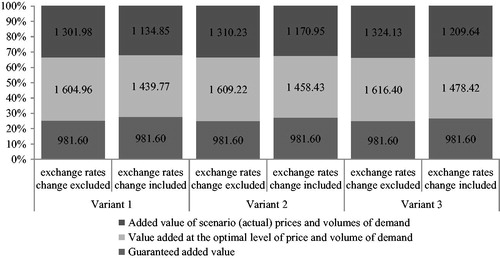
Figure 2. Dynamics of the added value of the participants in the chain (with milk and dairy products as an example) given a decrease in the share of imported components in comparable prices, million roubles: (a) added value in the chain in the optimal prices range and with optimal volume of demand; (b) added value at scenario (actual) prices and demand volumes. Source: Authors’ calculations.
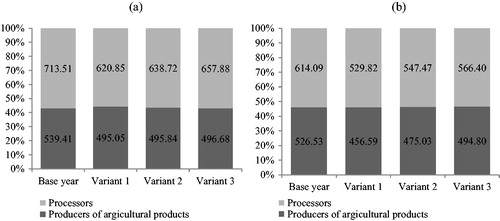
Figure 3. Structure of the integrated cost of cargo delivery to SATTKO by mode of transport, %. Source: Authors’ calculations.
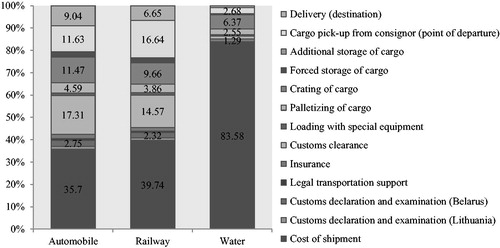
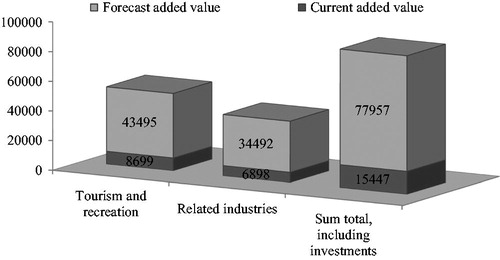
Figure 4. Value added in the tourism and recreation sector and related industries, according to investment project simulation results, mn roubles. Source: Authors’ calculations.