
Figures & data
Figure 1. R&D investment of semiconductor companies in Taiwan, 2005–2016.
Note: We take the natural logarithm of corporate R&D expenditures because the data is too large. Source: Taiwan’s new economic (TEJ) database.
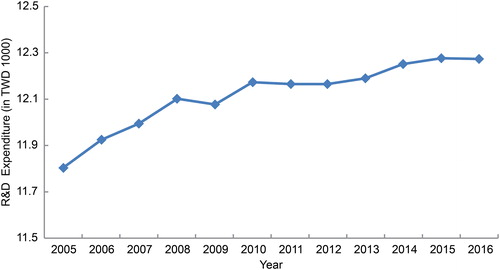
Figure 2. R.O.A. of R&D investment of semiconductor companies in Taiwan, 2005–2016. Source: Taiwan’s new economic (TEJ) database.
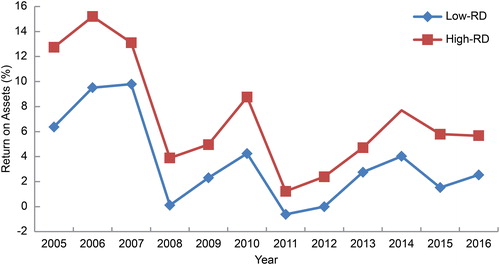
Table 1. R&D expenses of 96 companies, 2005–2016.
Table 2. Pearson correlation.
Table 3. Unit-root test results.
Table 4. Individual root-Fisher A.D.F. test.
Table 5. Impact of R.D.I. on R.O.A.