
Figures & data
Figure 1. CO2 in the emerging economies.
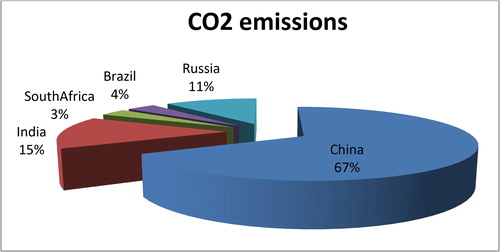
Figure 2. The Indirect connection between Remittances and CO2 emissions. Notes: PI = Personel Income; C = Consumption; S = Savings; AD = Aggregate Demand; BD = Bank Deposits; EG = Economic Growth.
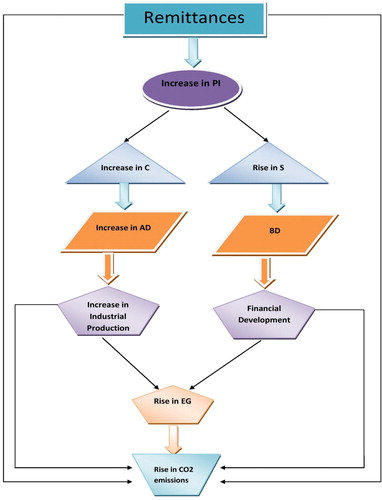
Figure 3. First stage of FSIM.
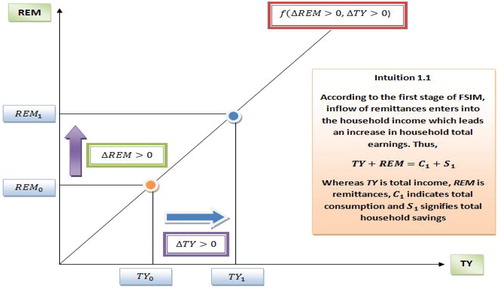
Figure 4. Second stage of FSIM.
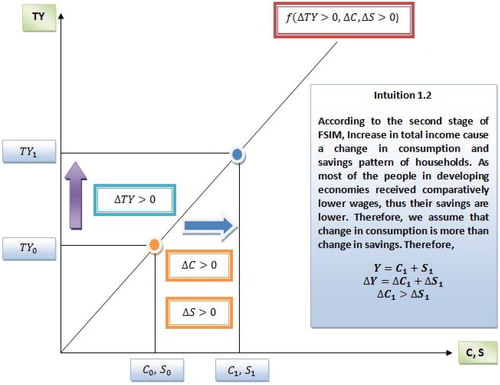
Figure 5. Third stage of FSIM.
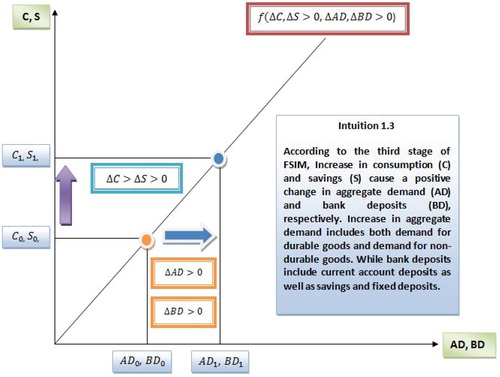
Figure 6. The Fourth stage of FSIM.
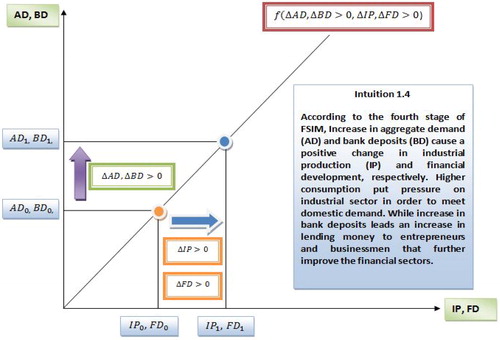
Figure 7. The Fifth stage of FSIM.
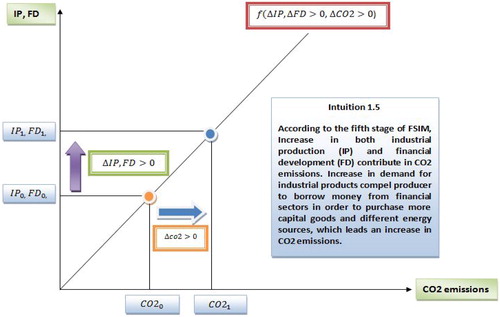
Figure 8. Derivation of FSIM curve.
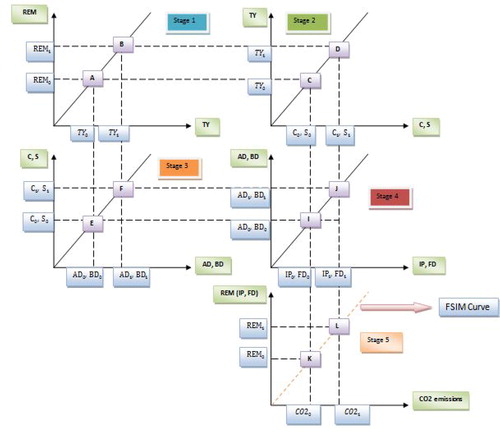
Figure 9. Relationships between negative shocks in inflow of remittances and CO2 emissions.
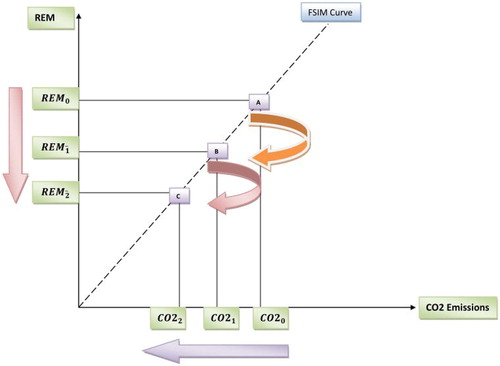
Figure 10. Relationships between positive shocks in inflow of remittances and CO2 emissions.
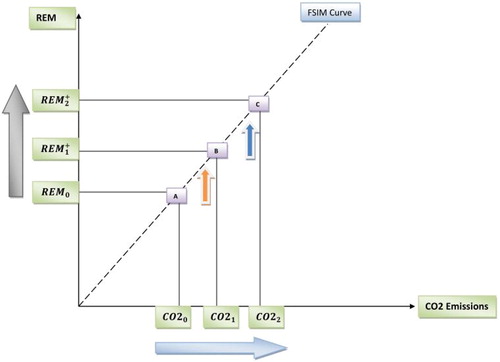
Figure 11. Relationship between Remittances and CO2 emissions for China.
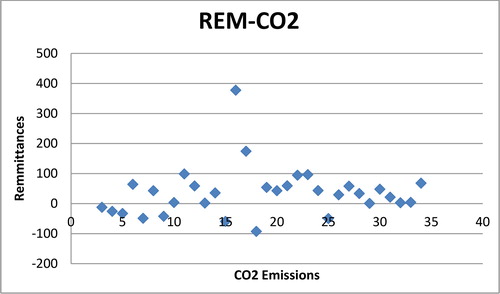
Table 1. ADF and PP unit root test.
Figure 12. Negative and Positive components of Remittances.
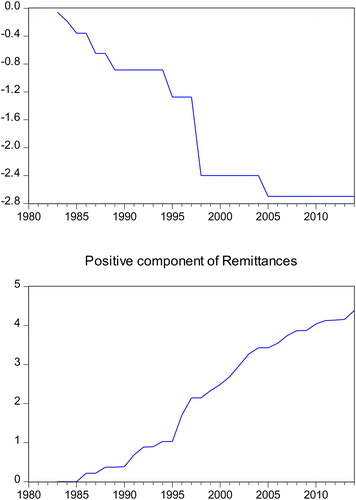
Table 2. Optimal lag and model selection criteria.
Table 3. Results of non-linear ARDL equation.
Table 4. Testing hypothesis of asymmetrical effect.
Figure 13. NARDL Dynamic Multiplier Graph.
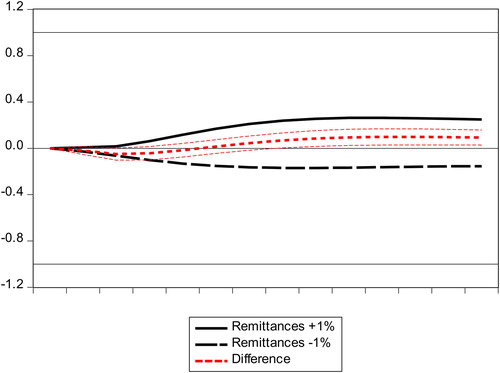
Figure 14. CUSUM Test.
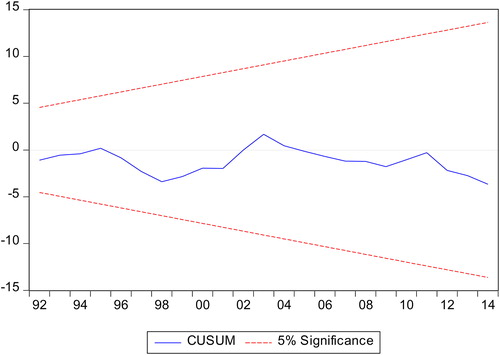
Figure 15. CUSUM of Square Test.
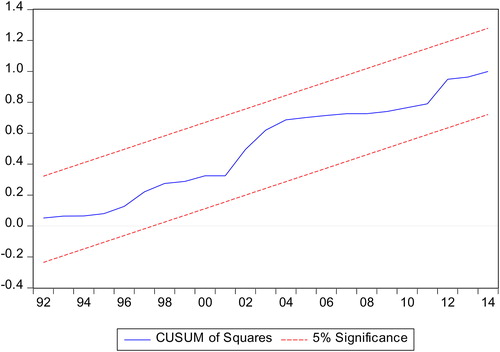
Table 5. Validation test.