
Figures & data
Figure 1. Sample path of S&P 500 returns and U.S. G.D.P. growth rates. Source: Wharton Research Data Services and the U.S. Bureau of Economic Analysis.
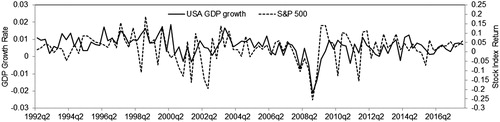
Figure 2. Sample path of S.H.A.S.H.R. returns and China G.D.P. growth rates. Source: Shanghai Stock Exchange and the National Bureau of Statistics of China.
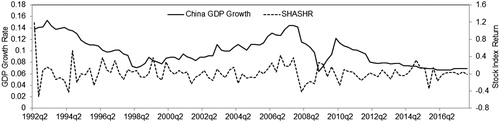
Table 1. Descriptive statistics of stock index returns and G.D.P. growth rates.
Table 2. Estimating results for the marginal distributions.
Figure 3. Dynamic correlations of stock return and economic growth. Source: Author’s estimations.
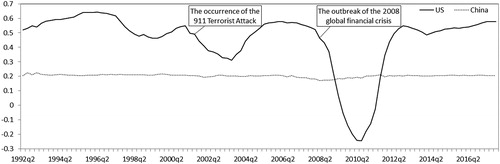
Table 3. Estimating results for copula functions.
Figure 4. Dynamic correlations of stock return and economic growth (robustness test). Source: Author’s estimations.
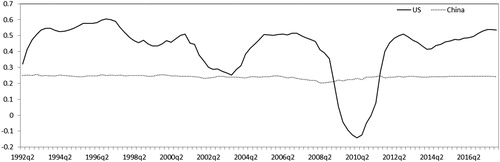
Table 4. Estimating results for copula functions (robustness test).