
Figures & data
Figure 1. Logarithms of the stock indices in 24 stock markets. Source:
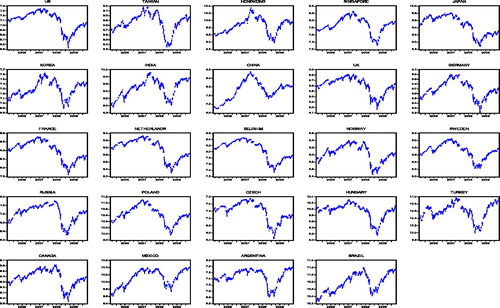
Figure 2. The stock index returns in 24 stock markets. Source:
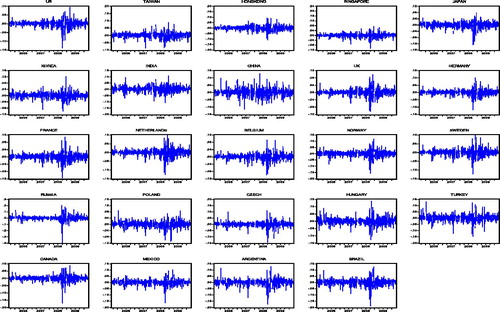
Table 1. Summary statistics for returns on stock indices.
Table 2. Results of various unit root tests.
Table 3. Results of the non-linear unit root test – the KSS test.
Table 4. ARMA (p, q)-GARCH (1, 1) modeling and results of the ARCH-LM test for the volatility of returns.
Figure 3. The volatility of returns in 24 stock markets. Source:
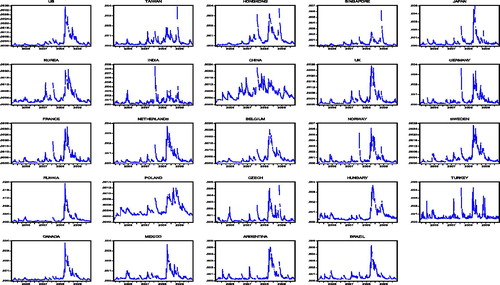
Table 5. Results of non-conditional correlation coefficients of returns.
Table 6. Results of correlation coefficients of volatility of returns.
Table 7. Results of the Engle-Granger test for co-integration.
Table 8. Results of the Enders-Siklos test for threshold co-integration.
Table 9. Results of the logistic smooth transition co-integration test.