Figures & data
Figure 1. Histogram for the occurrence of negative and spike LMPs.
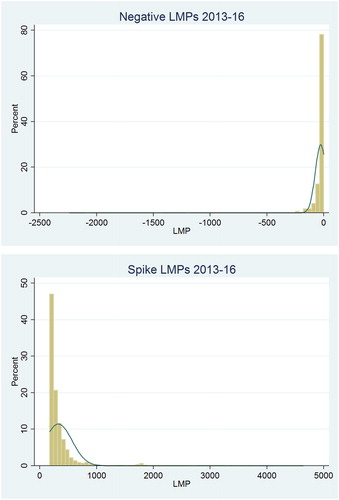
Table 1. Descriptive statistics of LMPs.
Table 2. Covariates of PCA.
Table 3. Variations explained by the eigenvalues of PCA.
Table 4. Covariate coefficients of six PCs.
Table 5. NARDL results.
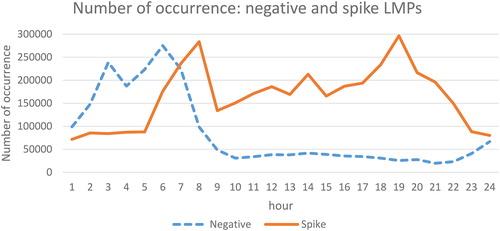
Figure 2. Distribution of negative and spike LMPs in one day.