
Figures & data
Figure A1. Architecture diagram of data analysis.
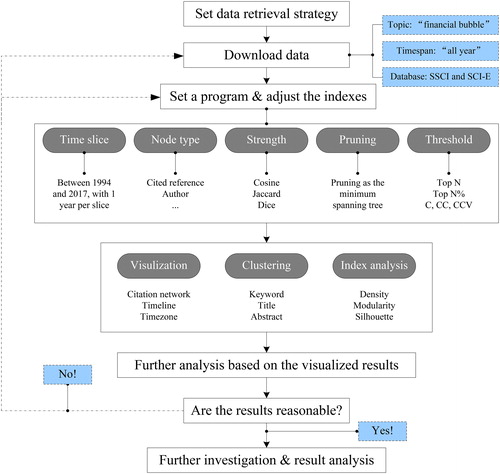
Figure A2. Number of publications in financial bubble research from 1994 to 2017.
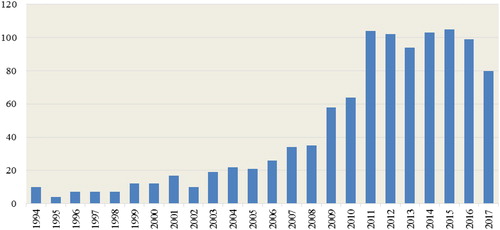
Figure A3. Number of citations per year in financial bubble research from 1994 to 2017.
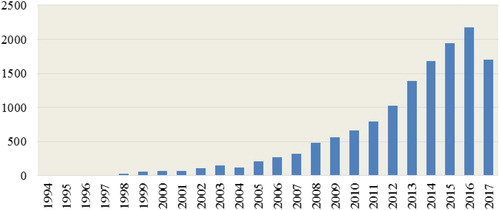
Figure A4. Cluster network in financial bubble research.
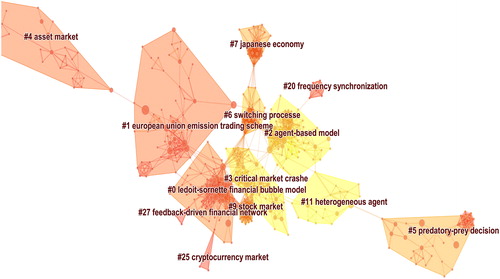
Figure A5. Main journals in financial bubble research.
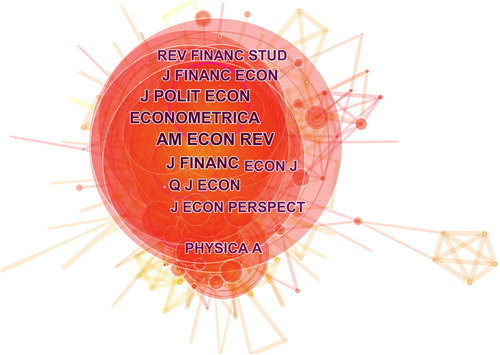
Figure A6. Timeline of top 20 cited articles each year.
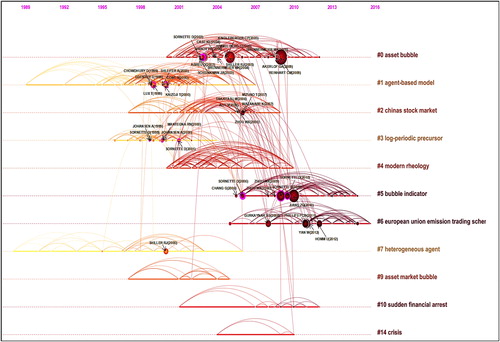
Table A1. Summary of the largest 10 clusters in financial bubble research.
Table A2. Top 10 subject categories in financial bubble research.
Table A3. Top 10 most productive sources in financial bubble research.
Table A4. Top 10 most productive authors in financial bubble research.
Table A5. Top 10 most productive countries in financial bubble research.
Table A6. Top 10 most productive institutions in financial bubble research.
Table A7. Top 20 references with the strongest citation bursts.
Table A8. Top 10 keywords with bursts.