
Figures & data
Figure 1. Research model.
Source: Own research.
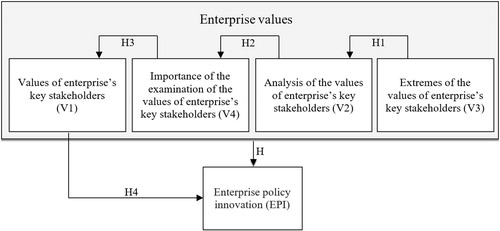
Figure 2. Results of structural model analysis.a
aPath significance (t-values): *** p < 0.001; standardised path coefficient is written “in” the line.
Source: Own research.
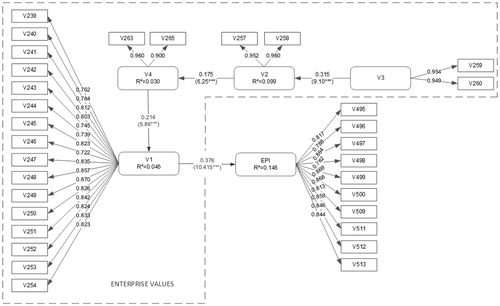
Table 2. Psychometric properties of the instrument (n = 734).
Table 1. Intercorrelations of latent variables.
Table 3. Number of indicators, explained variance (R2), AVE and blindfolding results of cv-communality (H2) and cv-redundancy (F2).