
Figures & data
Table 1. Results of R.E. and P.C.S.E. Models, E.U.-13 and E.U.-15, 1995–2016.
Figure 1. Intellectual capital in 2016 in E.U.-28, namely EDU_Tert (a), RD_exp (b), and Patents_recy (c).
Source: Authors’ processing in Stata, based on Eurostat data.
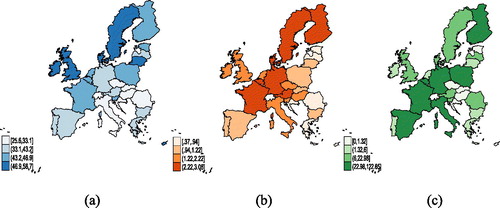
Figure 2. The main bioeconomy indicators in 2016 within the E.U.-28, namely Biorenew_P (a), Biomass_EXT (b), Biomass_TI (c), and Biomass_C (d).
Source: Authors’ processing in Stata based on Eurostat data.
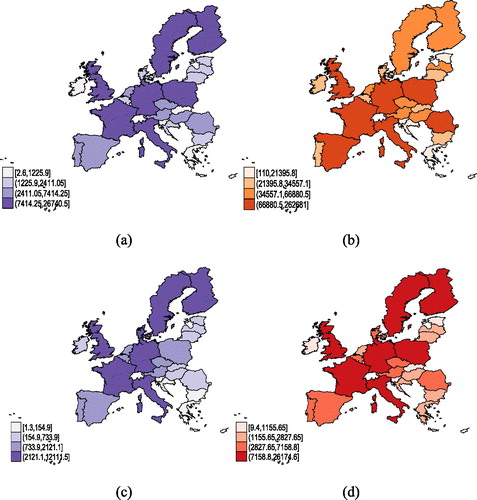
Table 2. Results of spatial analysis models, E.U.-13 and E.U.-15, 1995–2016.
Figure 3. S.E.M. models for bioeconomy and intellectual capital variables, E.U.-13 and E.U.-15, 1995–2016.
Source: own research in Stata.
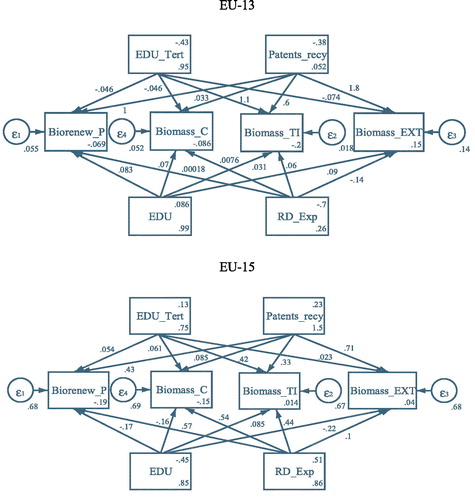
Table A1. Descriptive statistics, E.U.-13 and E.U.-15, 1995–2016.
Table A2a. Unit-root test (square root) for the residuals of models, E.U.-13 and E.U.-15, 1995–2016.
Table A2b. Robustness tests for RE models, E.U.-13 and E.U.-15, 1995–2016.
Table A3. S.E.M. results for Cronbach’s alpha, 1995–2016.
Table A4. Wald test for S.E.M. models, 1995–2016.
Table A5. Good-fit tests for S.E.M. models, 1995–2016.