
Figures & data
Figure 1. The number of published articles per year in credit risk research (1998–2017).
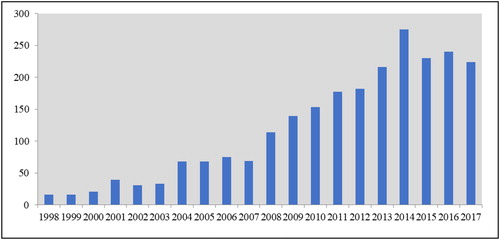
Figure 2. The documents types in credit risk research (1998–2017).
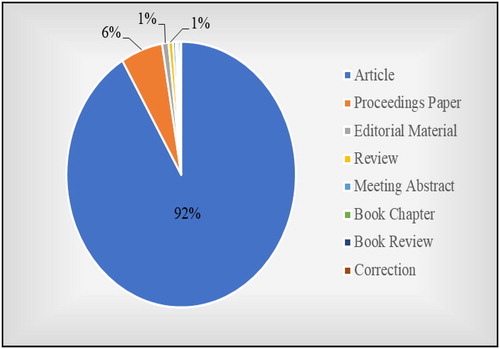
Table 1. The top 10 subject categories of W.o.S. in credit risk research (1998–2017).
Table 2. The top 10 research directions of W.o.S. in credit risk research (1998–2017).
Table 3. The top 20 most used articles of W.o.S. in credit risk research (1998–2017).
Figure 3. Work-flow diagram of credit risk research.
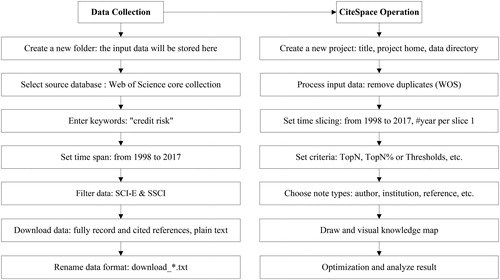
Figure 4. A visualisation of the author collaboration network.
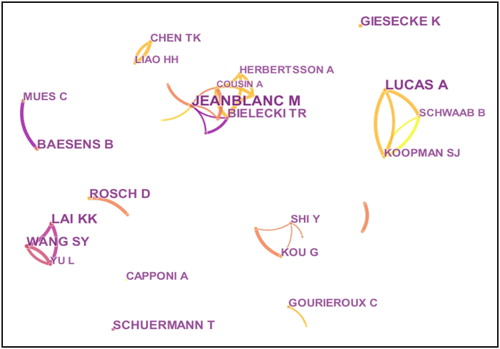
Figure 5. Collaboration history of two authors.
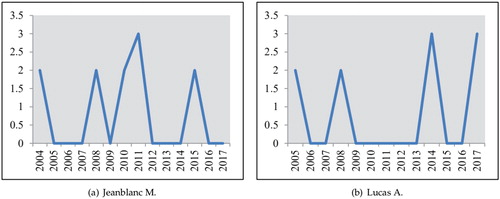
Table 4. Top 20 authors based on frequency in credit risk research.
Figure 6. A visualisation of the institution collaboration network.
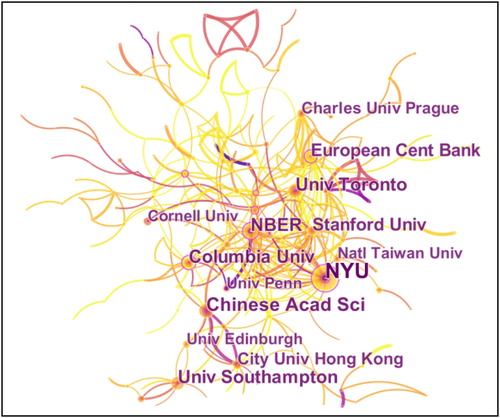
Table 5. Top 20 institutions based on frequency in credit risk research.
Figure 7. A visualisation of the country collaboration network.
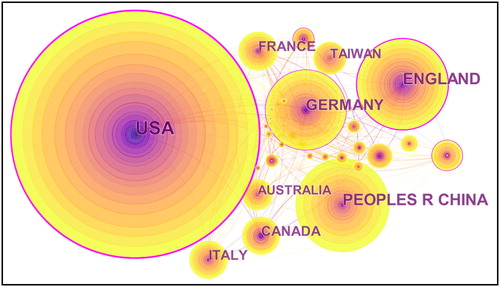
Table 6. Top 20 countries/territories based on frequency in credit risk research.
Figure 8. Geographical collaboration network in credit risk research.
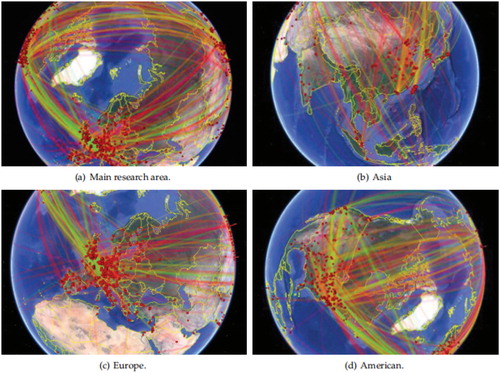
Figure 9. A visualisation of the document co-citation network.
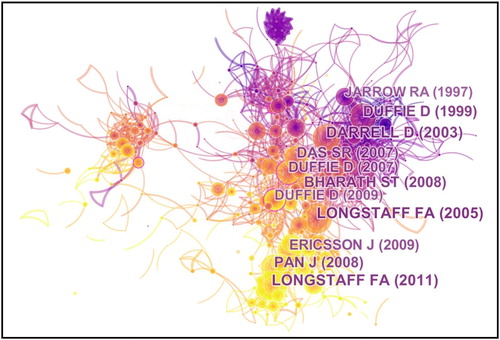
Figure 10. A timeline map of the references in credit risk research.
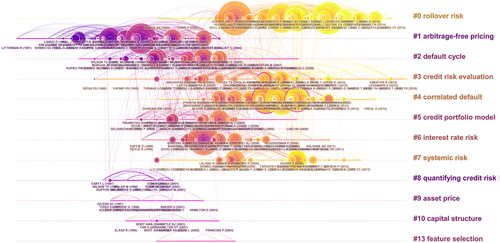
Table 7. Top 10 clusters based on size in credit risk research.
Table 8. Top 20 references based on frequency in credit risk research.
Table 9. Top 20 citing articles of the article entitled ‘Corporate yield spreads: Default risk or liquidity? New evidence from the credit default swap market.’
Figure 11. A visualisation of the author co-citation network.
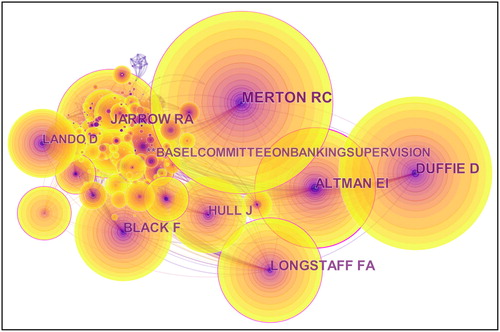
Table 10. Top 20 most cited authors based on frequency in credit risk research.
Figure 12. A visualisation of the main journals cluster network.
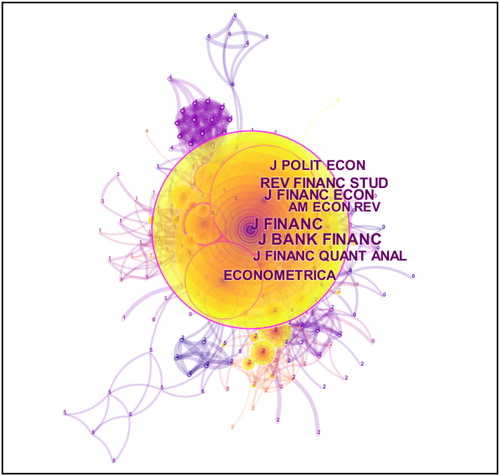
Table 11. Top 10 most cited journals based on frequency in credit risk research.
Figure 13. An overlay of the cited journal in credit risk research.
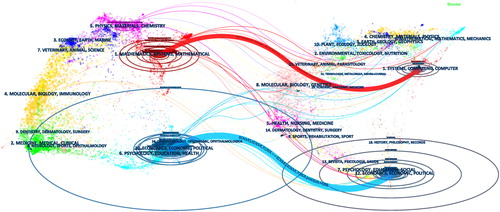
Table 12. Top 10 most prolific journals based on publication number in credit risk research.
Table 13. Top 20 keywords based on burst strength in credit risk research.