
Figures & data
Figure 1. Entrepreneurial zones by the size and regional location.
Source: Unified Register of Entrepreneurial Infrastructure.
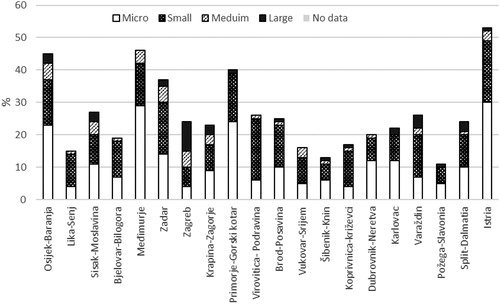
Figure 2. Entrepreneurial zones by the intensity of activation of the available area of the entrepreneurial zone and regional location.
Source: Unified Register of Entrepreneurial Infrastructure.
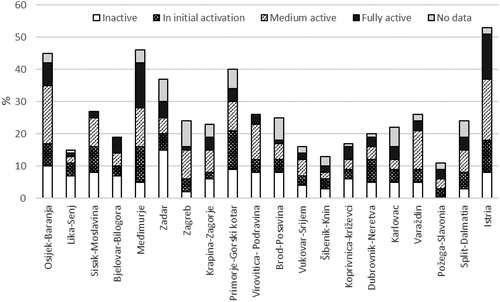
Figure 3. Entrepreneurial zones by the type of activity and regional location.
Source: Unified Register of Entrepreneurial Infrastructure.
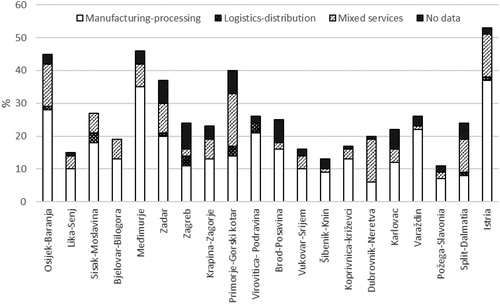
Table 1. Sample, n = 532.
Table 3. Comparison of mean values of fiscal performance indicators for local self-government units, t-test.
Table 4. Comparison of mean values of socioeconomic performance indicators of local self-government units, t-test.
Table 2. Descriptive statistics.
Table 5. Comparison of mean values of business performance indicators for entrepreneurs in local self-government units, t test.
Table A1. Data source.